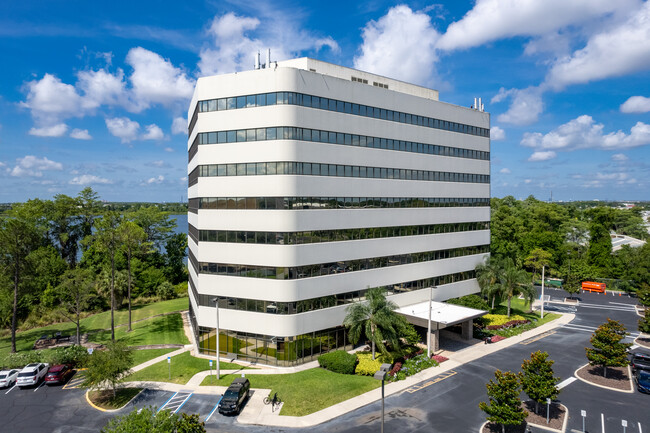
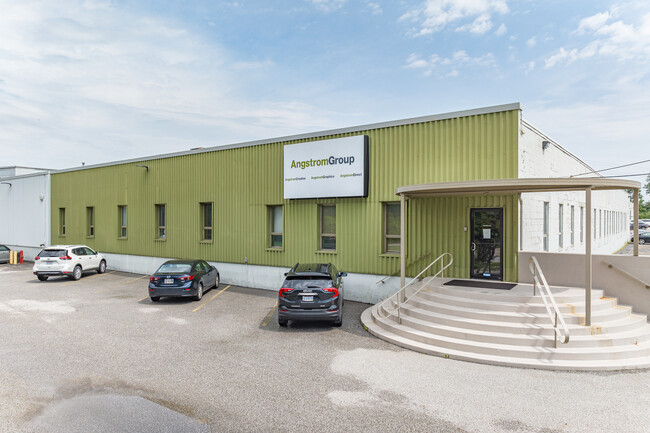
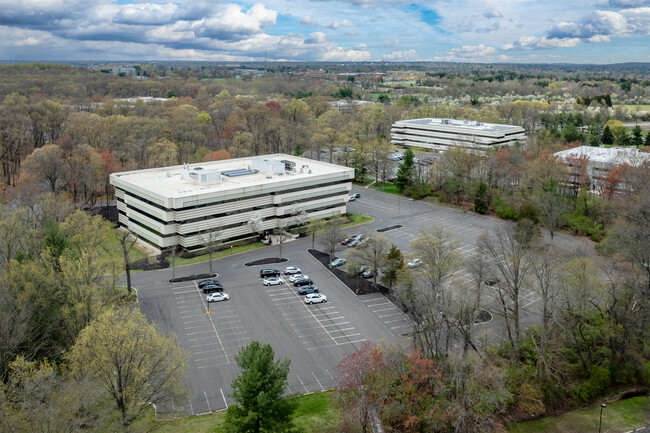
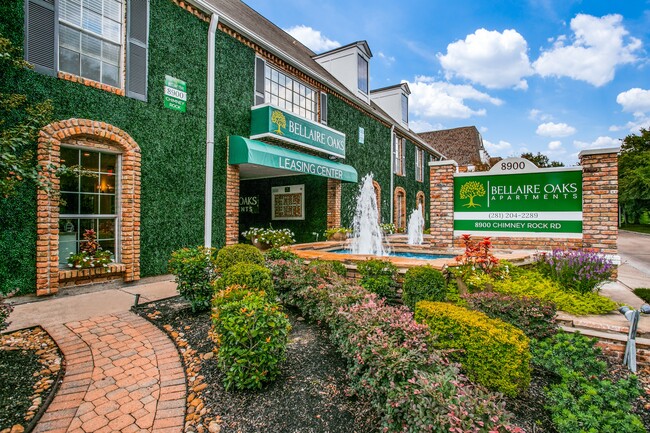
Office
- From $20 SF/YR
- 5900 Lake Ellenor Dr
- Orlando, FL 32809
- Up to 54,200 SF
For over 30 years, LoopNet has been the trusted brand for Commercial Real Estate
300K+
Active Listings
13M+
Monthly Visitors
$109B+
In Transaction Value


Houston,TX
Auction Starts
Starting Bid
Identify and bid on quality assets through our transparent and competitive platform—all online. Join the investors worldwide who have partnered with us to successfully transact 11,000+ properties.
Learn More About AuctionsLoopNet Listings Lease or Sell 14% Faster*

Right Audience
96% of the Fortune 1000 search on LoopNet

Engage Prospects
Stunning photography, videos and drone shots

More Opportunity
Find a tenant or buyer, faster than before
*Based on internal analysis comparing properties advertised on LoopNet to properties listed only on CoStar.
Yes, LoopNet operates globally, with dedicated platforms for commercial real estate in the UK, Canada, France, and Spain. These country specific versions offer localized commercial property listings and search capabilities.
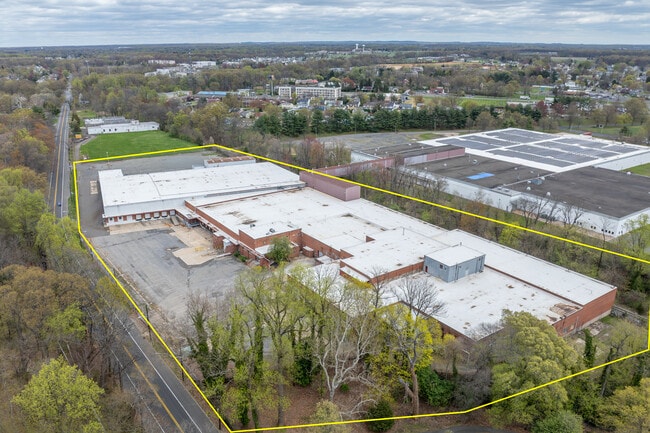
Deciding between coworking and traditional office space depends on your team's size, budget, and how quickly you need to move in.
For short term flexibility or shared amenities, coworking spaces may be the better fit. If you're evaluating commercial offices, understanding existing office space conditions, like whether it's shell, built out, or a spec suite, can help you estimate costs, occupancy timelines, and required build out work.
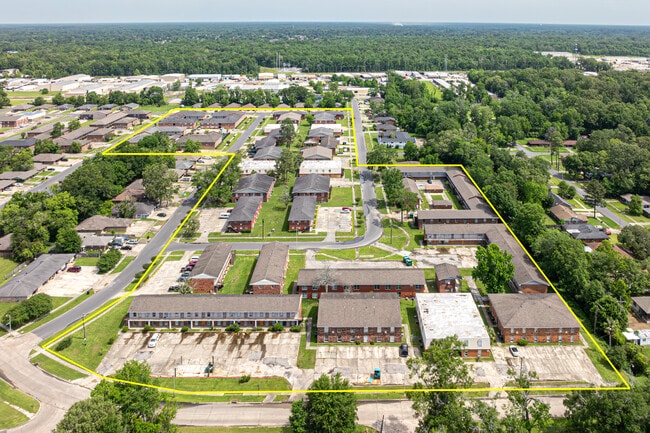
Multifamily properties offer steady cash flow, appreciation, and scalable management, making them a cornerstone of many investment portfolios. Key financial metrics like net operating income, cap rate, and internal rate of return help investors evaluate opportunities with precision.
If you're considering entering or expanding in this asset class, understanding multifamily investing fundamentals and knowing how to buy an apartment complex can help you make better informed decisions.
We apologize, but the feature you are trying to access is currently unavailable. We are aware of this issue and our team is working hard to resolve the matter.
Please check back in a few minutes. We apologize for the inconvenience.
- LoopNet Team