Property Record
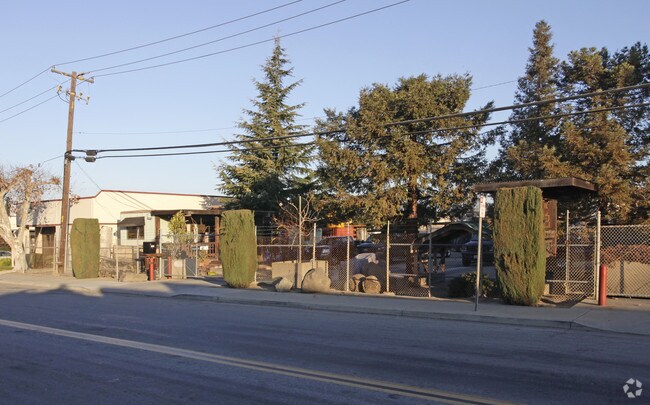
775 Mabury Rd, San Jose, CA 95133


NEARBY LISTINGS FOR SALE OR LEASE
Property Detail
775 Mabury Rd
241-08-011
LOT 1
Slaughterhousestockyard
Santa Clara
D
California
06085C0232H
1
2024
0.92 AC
2025
San Jose-Berryessa
504318
South Bay/San Jose
384 SF
San Jose-Sunnyvale-Santa Clara, CA
DEMOGRAPHICS near 775 Mabury Rd
1 Mile
3 Mile
5 Mile
2024 Total Population
20,817
212,891
583,676
2029 Population
20,248
205,370
561,686
Pop Growth 2024-2029
(2.73%)
(3.53%)
(3.77%)
Average Age
38
38
38
2024 Total Households
7,436
70,673
192,399
HH Growth 2024-2029
(2.84%)
(3.52%)
(3.82%)
Median Household Inc
$129,450
$108,871
$122,599
Avg Household Size
2.70
2.80
2.80
2024 Avg HH Vehicles
2.00
2.00
2.00
Median Home Value
$926,506
$1,005,331
$1,023,595
Median Year Built
1988
1979
1976
Nearby Places
Map Layers
Map Styles
 Street
 Aerial
- Restaurants
- Banks
- Shops
- Fitness
- Groceries
PUBLIC TRANSPORTATION
COMMUTER RAIL
DRIVE
WALK
Distance
7 min
2.8 mi
DRIVE
WALK
Distance
9 min
3.4 mi
AIRPORT
Norman Y Mineta San Jose International
DRIVE
WALK
Distance
Norman Y Mineta San Jose International
7 min
3.9 mi
Metro Oakland International
DRIVE
WALK
Distance
Metro Oakland International
43 min
34.1 mi
San Francisco International
DRIVE
WALK
Distance
San Francisco International
43 min
34.8 mi
Freight Ports
Port of Redwood City
DRIVE
WALK
Distance
Port of Redwood City
28 min
21.6 mi
Nearby Properties
Address
Land Use
TOTAL SIZE
Lot Size
Zoning
Address
Land Use
TOTAL SIZE
Lot Size
Zoning
2.50 AC
DC
Address
Land Use
TOTAL SIZE
Lot Size
Zoning
576,892 SF
8.28 AC
APD
Address
Land Use
TOTAL SIZE
Lot Size
Zoning
74,528 SF
9.26 AC
TEC
Address
Land Use
TOTAL SIZE
Lot Size
Zoning
194,790 SF
5.30 AC
APDCI
Address
Land Use
TOTAL SIZE
Lot Size
Zoning
1.73 AC
DC
Address
Land Use
TOTAL SIZE
Lot Size
Zoning
837,391 SF
1.42 AC
DC
Address
Land Use
TOTAL SIZE
Lot Size
Zoning
242,320 SF
8.01 AC
TEC
Address
Land Use
TOTAL SIZE
Lot Size
Zoning
33.32 AC
R140
Address
Land Use
TOTAL SIZE
Lot Size
Zoning
281,574 SF
32.09 AC
IP
Address
Land Use
TOTAL SIZE
Lot Size
Zoning
320,000 SF
15.18 AC
APD
Address
Land Use
TOTAL SIZE
Lot Size
Zoning
486,104 SF
5.43 AC
ML
Address
Land Use
TOTAL SIZE
Lot Size
Zoning
194,530 SF
12.26 AC
APD
Address
Land Use
TOTAL SIZE
Lot Size
Zoning
590,000 SF
2.33 AC
C3
Address
Land Use
TOTAL SIZE
Lot Size
Zoning
557,448 SF
1.46 AC
DC
Address
Land Use
TOTAL SIZE
Lot Size
Zoning
333,472 SF
1.24 AC
APD
Address
Land Use
TOTAL SIZE
Lot Size
Zoning
290,589 SF
15.09 AC
IP
Address
Land Use
TOTAL SIZE
Lot Size
Zoning
289,503 SF
0.97 AC
DC
Address
Land Use
TOTAL SIZE
Lot Size
Zoning
330,927 SF
2.35 AC
M1
Address
Land Use
TOTAL SIZE
Lot Size
Zoning
445,687 SF
6.44 AC
A(PD)
Address
Land Use
TOTAL SIZE
Lot Size
Zoning
340,000 SF
0.65 AC
CG(PD
Address
Land Use
TOTAL SIZE
Lot Size
Zoning
194,549 SF
2.76 AC
APDCI
Address
Land Use
TOTAL SIZE
Lot Size
Zoning
505,150 SF
35.68 AC
CIC
Address
Land Use
TOTAL SIZE
Lot Size
Zoning
381,000 SF
1.40 AC
DC
Address
Land Use
TOTAL SIZE
Lot Size
Zoning
39.81 AC
IP
Address
Land Use
TOTAL SIZE
Lot Size
Zoning
429,535 SF
7.44 AC
C
Address
Land Use
TOTAL SIZE
Lot Size
Zoning
491,622 SF
4.18 AC
A(PD)
Address
Land Use
TOTAL SIZE
Lot Size
Zoning
286,350 SF
0.80 AC
C
Address
Land Use
TOTAL SIZE
Lot Size
Zoning
62,280 SF
14.16 AC
IP
Address
Land Use
TOTAL SIZE
Lot Size
Zoning
299,278 SF
3.67 AC
M1
Address
Land Use
TOTAL SIZE
Lot Size
Zoning
199,175 SF
8.32 AC
IP(PD
The World's #1 Commercial Real Estate Marketplace
Connect with us
© 2026 CoStar Group
The information above has been obtained from sources believed reliable. While we do not doubt its accuracy we have not verified it and make no guarantee, warranty or representation about it. It is your responsibility to independently confirm its accuracy and completeness. Any projections, opinions, assumptions, or estimates used are for example only and do not represent the current or future performance of the property. The value of this transaction to you depends on tax and other factors which should be evaluated by your tax, financial, and legal advisors. You and your advisors should conduct a careful, independent investigation of the property to determine to your satisfaction the suitability of the property for your needs.