Log In/Sign Up
Your email has been sent.

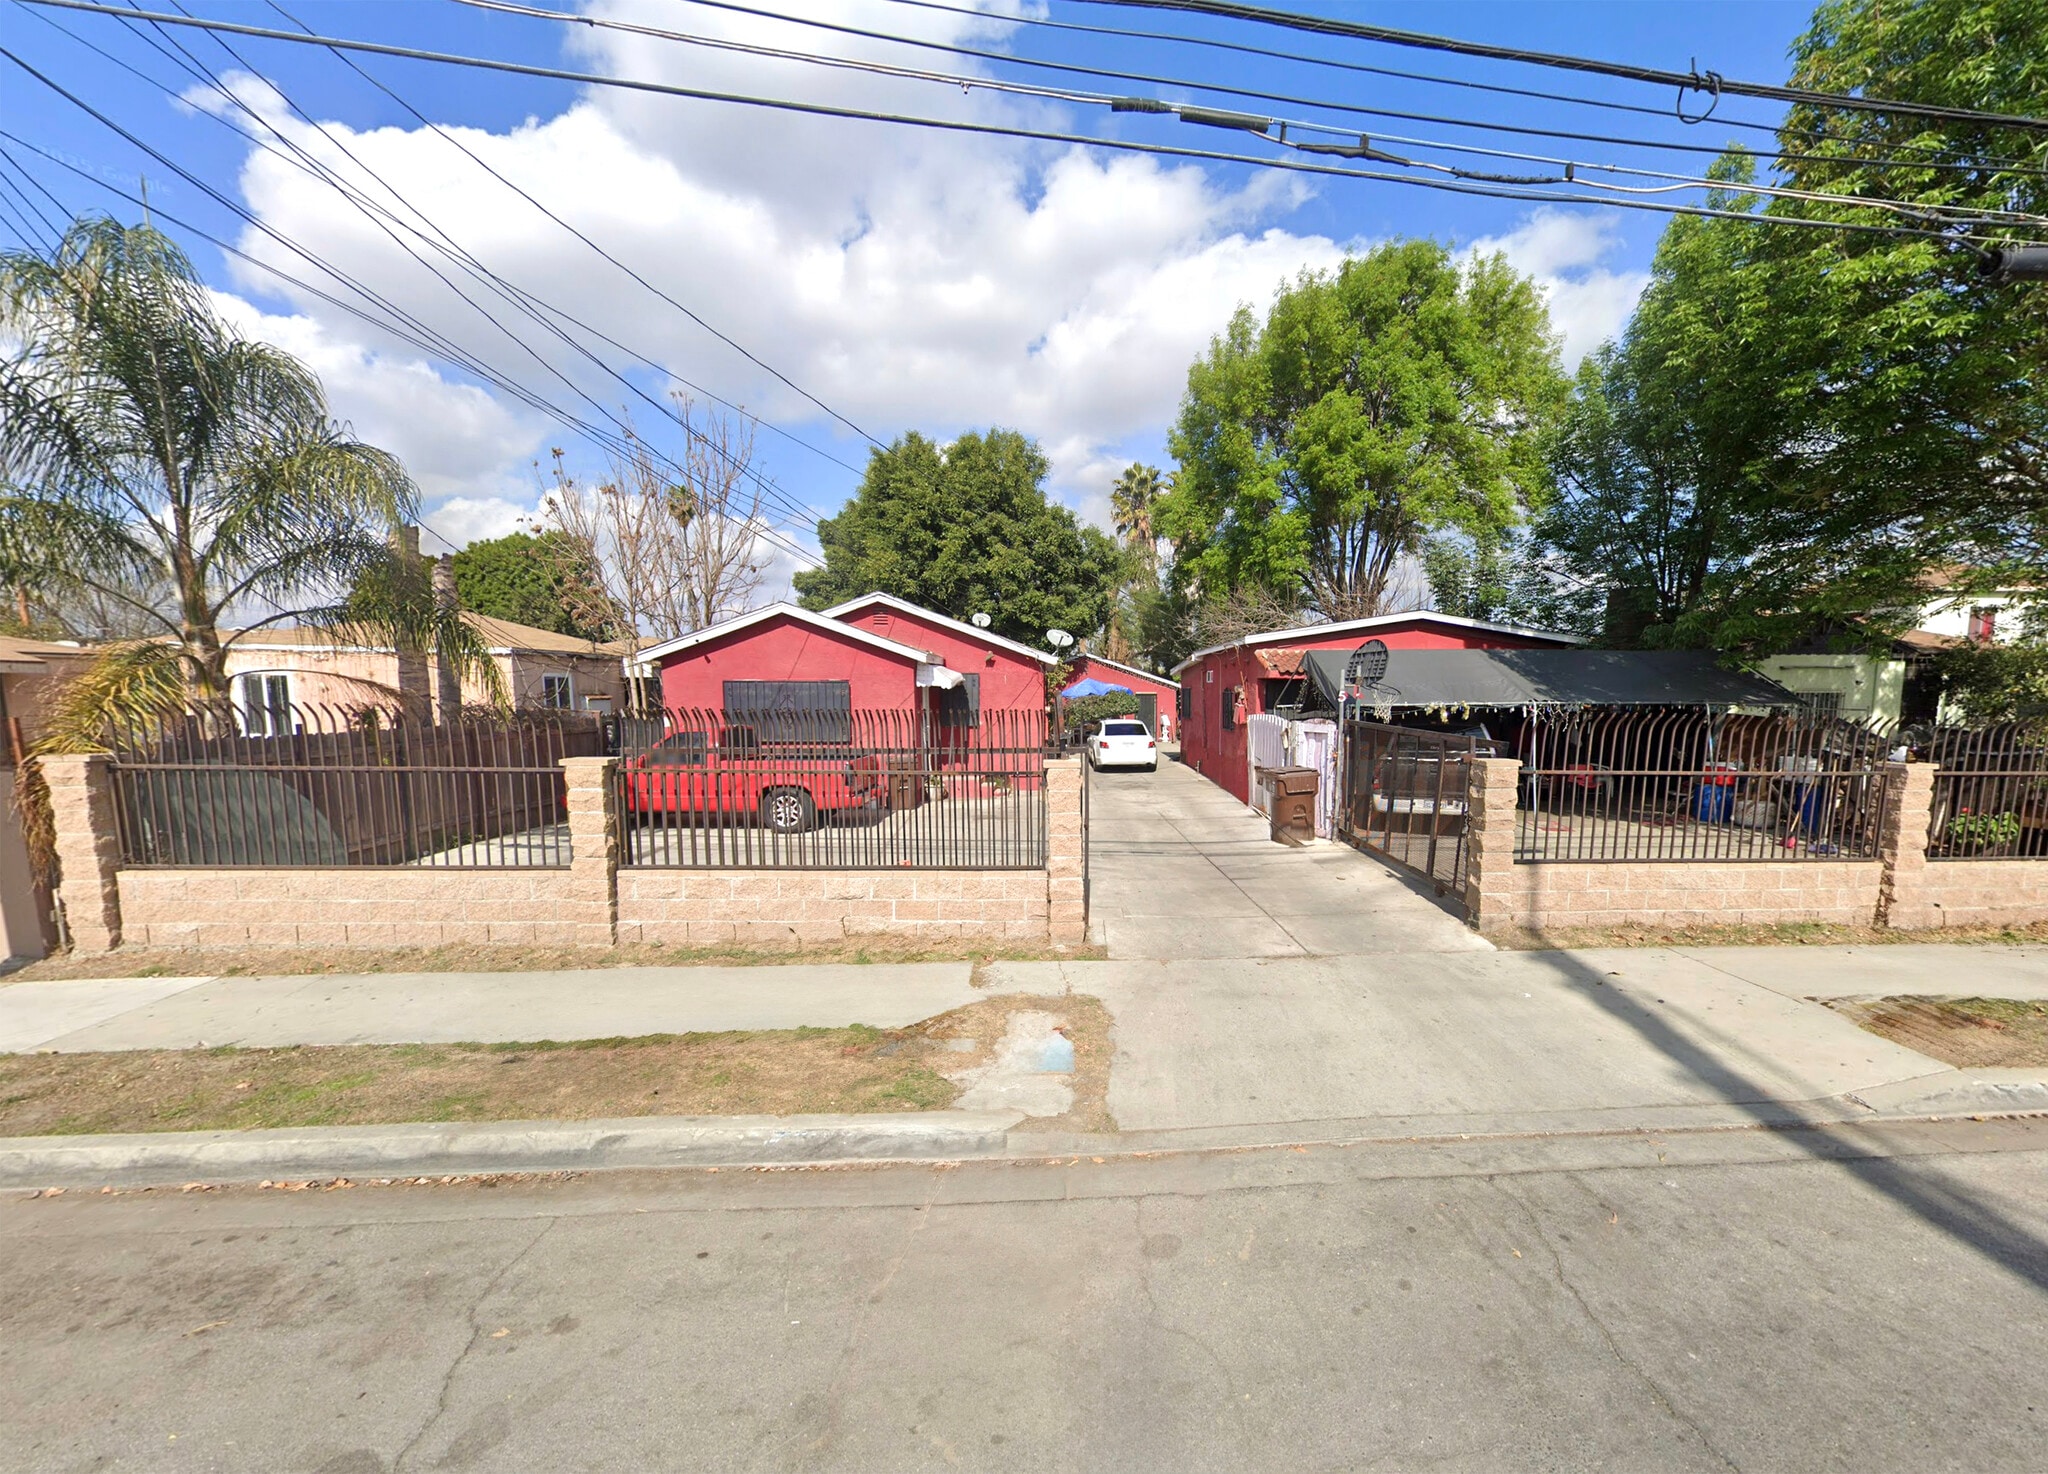
Compton Investment With Below Market Rent 519 E Oaks St 3 Unit Apartment Building $725,000 ($241,667/Unit) 6.93% Cap Rate Compton, CA 90221

INVESTMENT HIGHLIGHTS
- 3 Stand Alone Buildings on 21,780 SF of Land
- Legal Non-Conforming Use is a Triplex (All 2-Bedroom Units)
- 1-Mile South of Century (105) Freeway
- Potential to Occupy One For a Home Office and Rent Out Two For Income
- Just West of Santa Fe Ave 3 Blocks North of Rosecrans Ave
EXECUTIVE SUMMARY
Price reduced! Seller motivated! Apartment investment opportunity. 3 stand-alone buildings: 2,220 sq.ft. home office on 21,780± sq.ft. of contractor’s yard land. Ideal to occupy one of the buildings for a home office for a contractor business. Rent out the other two buildings for investment income. Legal non-conforming use is currently a triplex with three 2-bedroom residential units. $4,840 current below market monthly income (month-to-month tenancy). $50,274 pro forma NOI with 6.93% cap rate. Located just west of Santa Fe Avenue and 3 blocks north of Rosecrans Avenue. One mile south of the Century (105) Freeway. Zoning code 30-14.4 may allow: Accessory storage of automobiles (in operating condition); building materials (excluding rock, gravel, and sand storage in excess of 2,000 tons); equipment, lumber, pipe, wood, cabinet and carpentry shops; carpet cleaning; pest control operator.
FINANCIAL SUMMARY (PRO FORMA - 2025) |
ANNUAL | ANNUAL PER SF |
|---|---|---|
| Gross Rental Income |
$71,820

|
$18.90
|
| Other Income |
-
|
-
|
| Vacancy Loss |
-
|
-
|
| Effective Gross Income |
$71,820
|
$18.90
|
| Taxes |
-
|
-
|
| Operating Expenses |
$21,546
|
$5.67
|
| Total Expenses |
$21,546
|
$5.67
|
| Net Operating Income |
$50,274
|
$13.23
|
FINANCIAL SUMMARY (PRO FORMA - 2025)
| Gross Rental Income | |
|---|---|
| Annual | $71,820 |
| Annual Per SF | $18.90 |
| Other Income | |
|---|---|
| Annual | - |
| Annual Per SF | - |
| Vacancy Loss | |
|---|---|
| Annual | - |
| Annual Per SF | - |
| Effective Gross Income | |
|---|---|
| Annual | $71,820 |
| Annual Per SF | $18.90 |
| Taxes | |
|---|---|
| Annual | - |
| Annual Per SF | - |
| Operating Expenses | |
|---|---|
| Annual | $21,546 |
| Annual Per SF | $5.67 |
| Total Expenses | |
|---|---|
| Annual | $21,546 |
| Annual Per SF | $5.67 |
| Net Operating Income | |
|---|---|
| Annual | $50,274 |
| Annual Per SF | $13.23 |
PROPERTY FACTS
UNIT MIX INFORMATION
| DESCRIPTION | NO. UNITS | AVG. RENT/MO | SF |
|---|---|---|---|
| 2+1 | 3 | - | 2,220 |


1 of 14
VIDEOS
MATTERPORT 3D EXTERIOR
MATTERPORT 3D TOUR
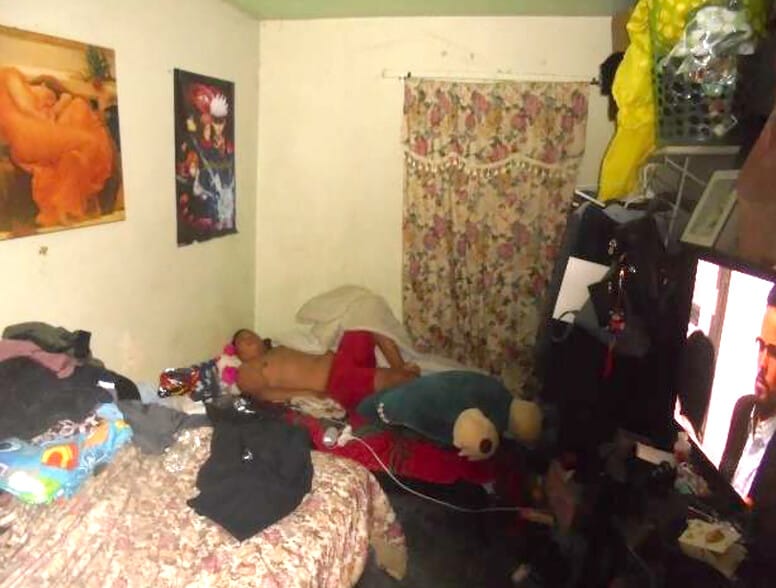
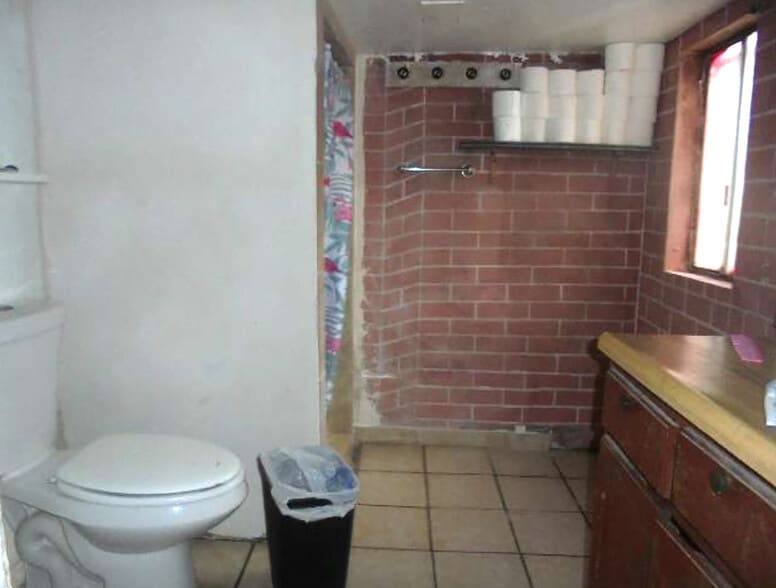
PHOTOS
STREET VIEW
STREET
MAP
Presented by
Compton Investment With Below Market Rent | 519 E Oaks St
Already a member? Log In
Hmm, there seems to have been an error sending your message. Please try again.
Thanks! Your message was sent.