Log In/Sign Up
Your email has been sent.

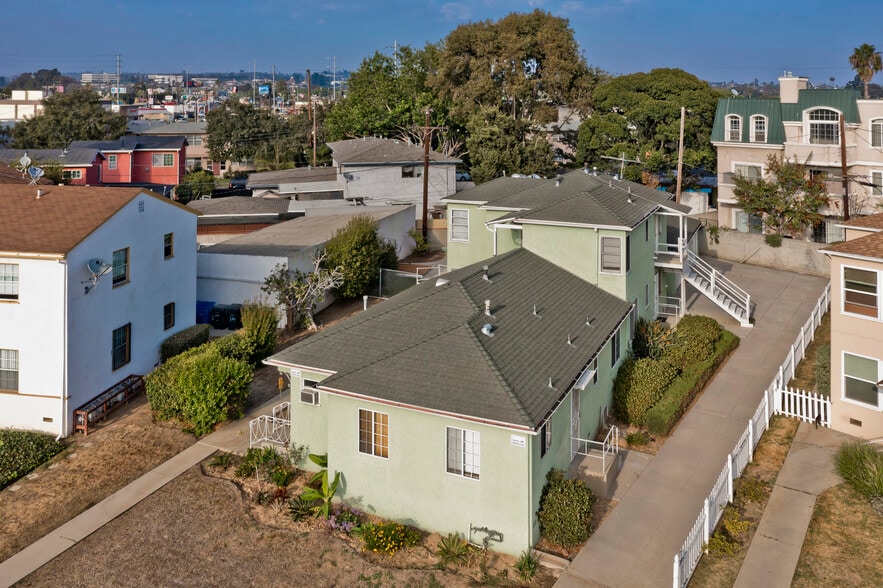
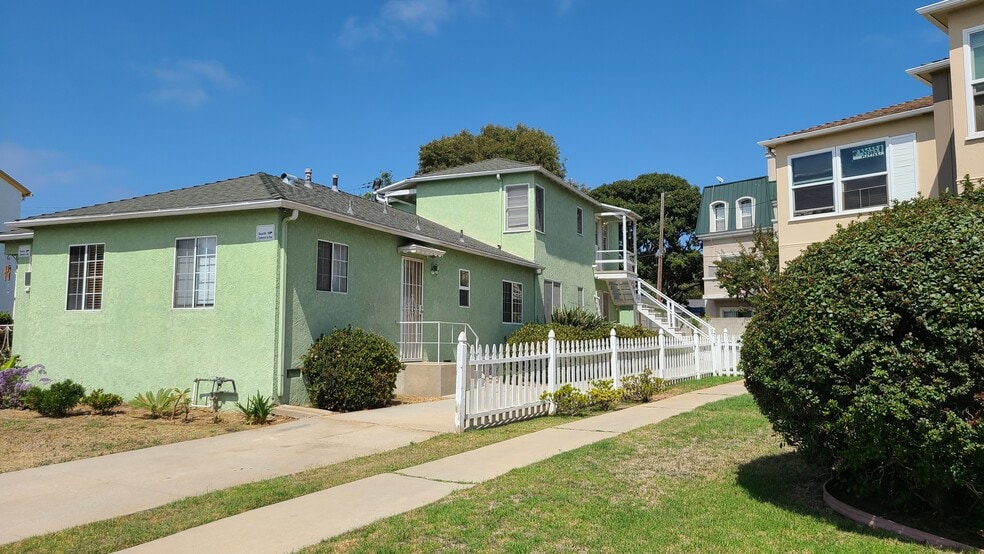
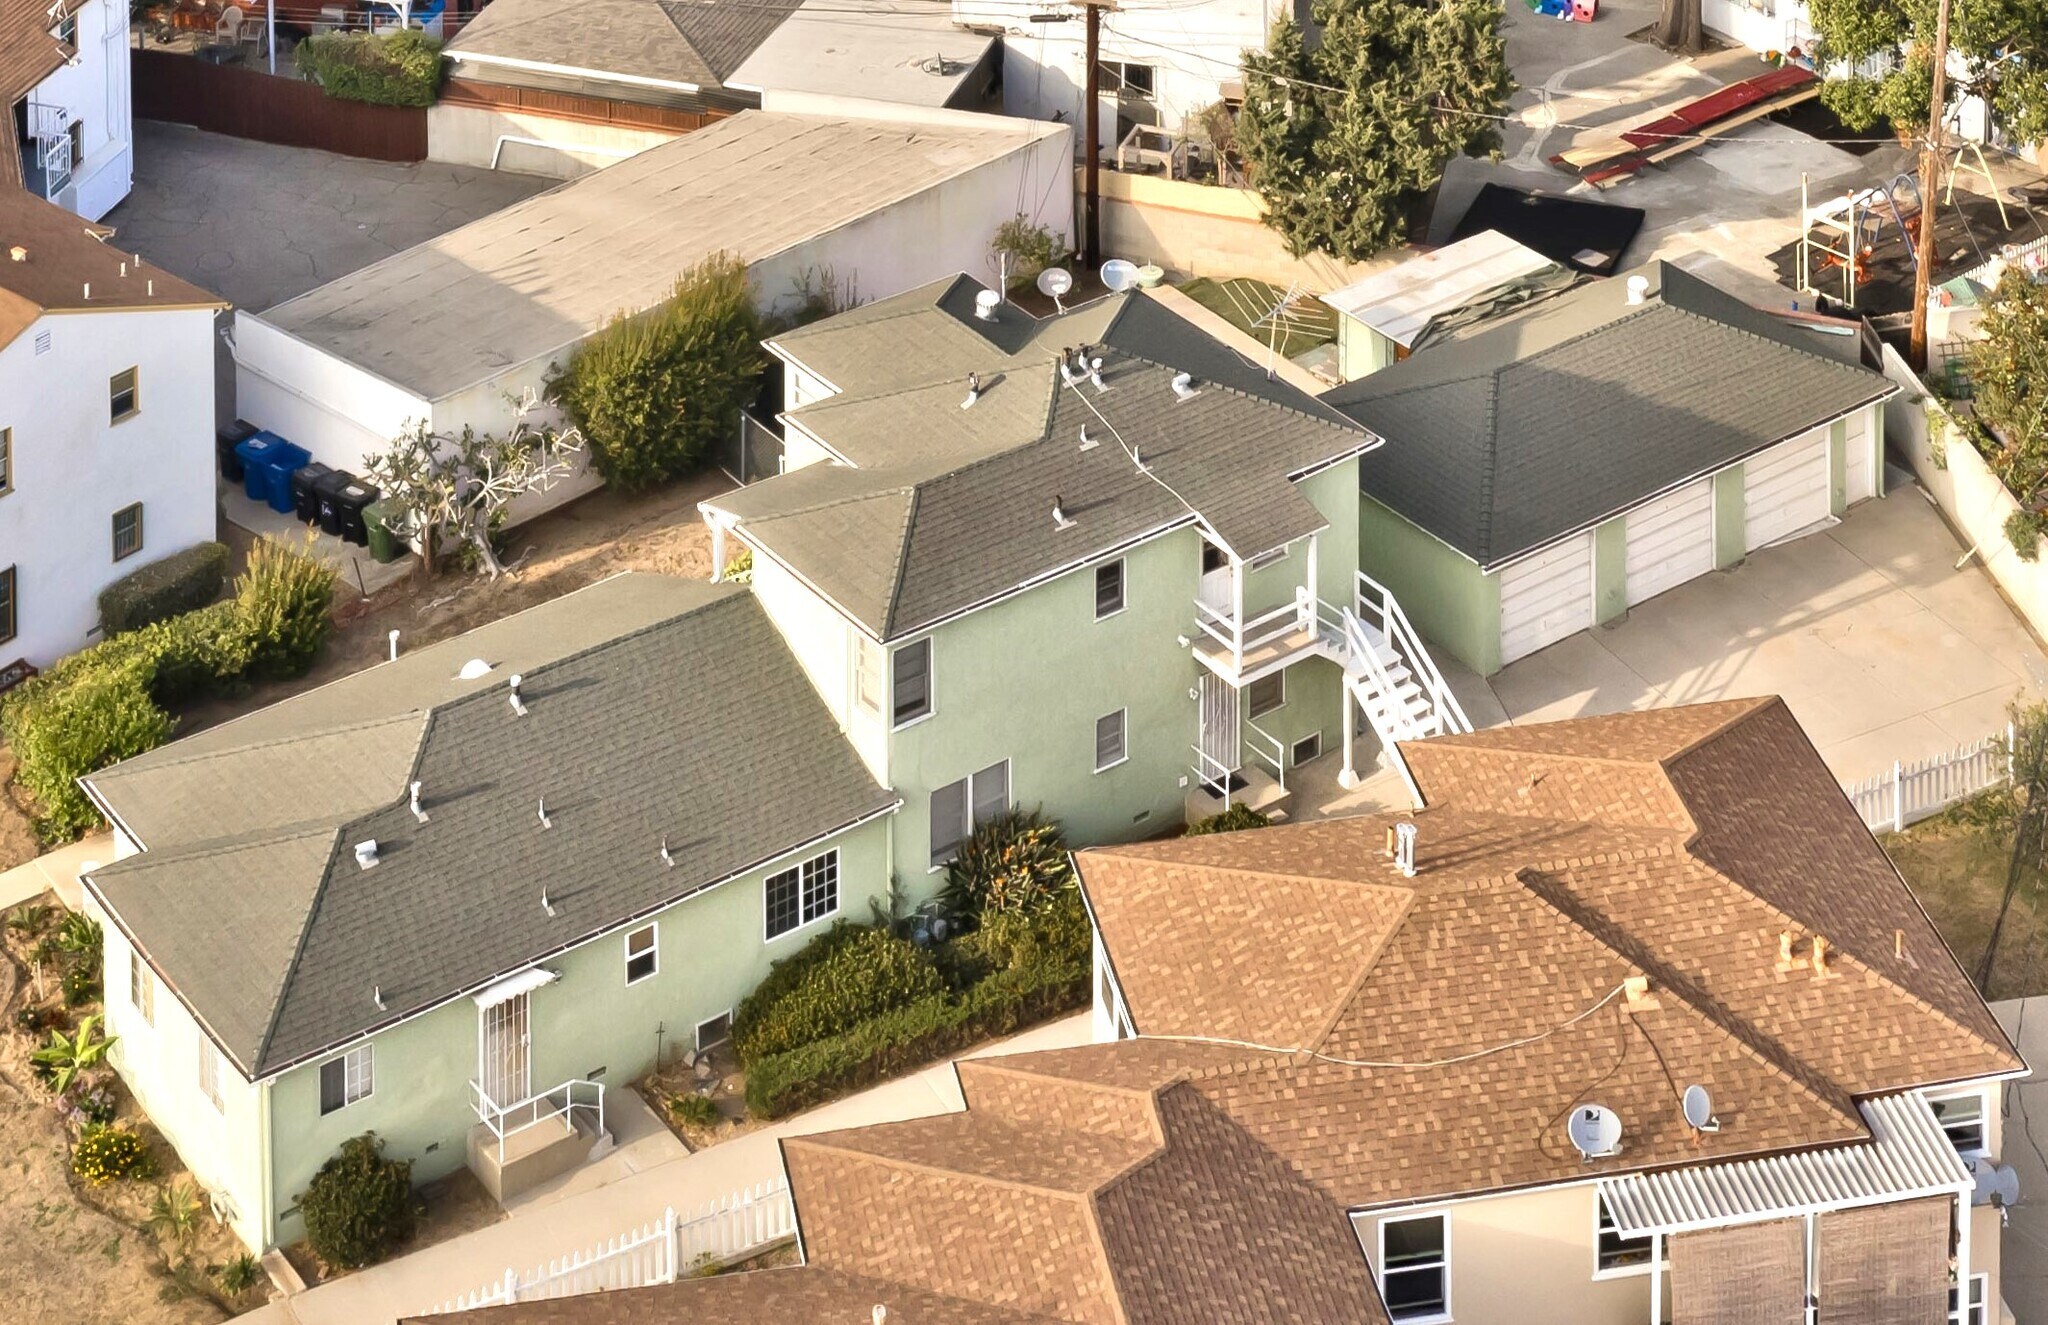
6922 Glasgow Ave 3 Unit Apartment Building $1,450,000 ($483,333/Unit) Los Angeles, CA 90045

Executive Summary
Triplex in the trending Westchester neighborhood of Los Angeles! Currently one of the most sought after multifamily rental pockets due to recent major area development and in-place prime demographics which include an average household income of $90,782 within a 1-mile radius and a population of 830,616 residents and 321,000 employees within a 5 miles radius to draw upon. Ease of management unit mix: 1 bed 1 bath 750 sq. ft. |1 bed 1 bath 750 sq. ft. | 2 bed 1 bath 1,025 sq. ft. Clean building with large, updated units and well laid out floor plans with an emphasis on functionality and natural lighting. Tenants enjoy in unit washer/dryer and rear on-site garage parking. Neighborhood walk score of 83 highlighted by a 3-minute walk to the newly built Interchange at La Cienega Retail Center anchored by Amazon Fresh. 5-minute drive to Ralphs, CVS, Smart & Final, Starbucks, and Trader Joe's. 10-minute drive to Loyola Marymount University, Pepperdine University West Los Angeles Graduate Campus, Westfield Mall Culver City, The Promenade at Howard Hughes Center, Los Angeles International Airport, SoFi Stadium, Kenneth Hahn State Recreation Area, Ballona Creek Bike Path, and Dockweiler State Beach. Superior access to the 405 Freeway. Bonus upside/value add LAR3 zoning optional rear ADU or JADU add on project or full development.
Financial Summary (Actual - 2025) |
Annual | Annual Per SF |
|---|---|---|
| Gross Rental Income |
$81,000

|
$32.04
|
| Other Income |
-
|
-
|
| Vacancy Loss |
-
|
-
|
| Effective Gross Income |
$81,000
|
$32.04
|
| Taxes |
-
|
-
|
| Operating Expenses |
-
|
-
|
| Total Expenses |
$22,815
|
$9.02
|
| Net Operating Income |
$58,185
|
$23.02
|
Financial Summary (Actual - 2025)
| Gross Rental Income | |
|---|---|
| Annual | $81,000 |
| Annual Per SF | $32.04 |
| Other Income | |
|---|---|
| Annual | - |
| Annual Per SF | - |
| Vacancy Loss | |
|---|---|
| Annual | - |
| Annual Per SF | - |
| Effective Gross Income | |
|---|---|
| Annual | $81,000 |
| Annual Per SF | $32.04 |
| Taxes | |
|---|---|
| Annual | - |
| Annual Per SF | - |
| Operating Expenses | |
|---|---|
| Annual | - |
| Annual Per SF | - |
| Total Expenses | |
|---|---|
| Annual | $22,815 |
| Annual Per SF | $9.02 |
| Net Operating Income | |
|---|---|
| Annual | $58,185 |
| Annual Per SF | $23.02 |
Property Facts
| Price | $1,450,000 | Lot Size | 0.21 AC |
| Price Per Unit | $483,333 | Building Size | 2,528 SF |
| Sale Type | Investment | Average Occupancy | 100% |
| No. Units | 3 | No. Stories | 2 |
| Property Type | Multifamily | Year Built | 1948 |
| Property Subtype | Apartment | Parking Ratio | 1.19/1,000 SF |
| Building Class | C | ||
| Zoning | LAR3 - Bonus/Value-add upside LAR3 zoning land components | ||
| Price | $1,450,000 |
| Price Per Unit | $483,333 |
| Sale Type | Investment |
| No. Units | 3 |
| Property Type | Multifamily |
| Property Subtype | Apartment |
| Building Class | C |
| Lot Size | 0.21 AC |
| Building Size | 2,528 SF |
| Average Occupancy | 100% |
| No. Stories | 2 |
| Year Built | 1948 |
| Parking Ratio | 1.19/1,000 SF |
| Zoning | LAR3 - Bonus/Value-add upside LAR3 zoning land components |
Unit Mix Information
| Description | No. Units | Avg. Rent/Mo | SF |
|---|---|---|---|
| 2+1 | 1 | $2,350 | - |
| 1+1 | 1 | $2,150 | - |
| 1+1 | 1 | $2,250 | - |


Moderately walkable
70/100
Exceptionally drivable
90/100
Some public transit
50/100
Fairly bikeable
50/100
Property Taxes
| Parcel Number | 4103-012-016 | Improvements Assessment | $557,756 |
| Land Assessment | $1,450,172 | Total Assessment | $2,007,928 |
Property Taxes
Parcel Number
4103-012-016
Land Assessment
$1,450,172
Improvements Assessment
$557,756
Total Assessment
$2,007,928

1 of 22
Videos
Matterport 3D Exterior
Matterport 3D Tour
Photos
Street View
Street
Map
Presented by
6922 Glasgow Ave
Already a member? Log In
Hmm, there seems to have been an error sending your message. Please try again.
Thanks! Your message was sent.