Log In/Sign Up
Your email has been sent.

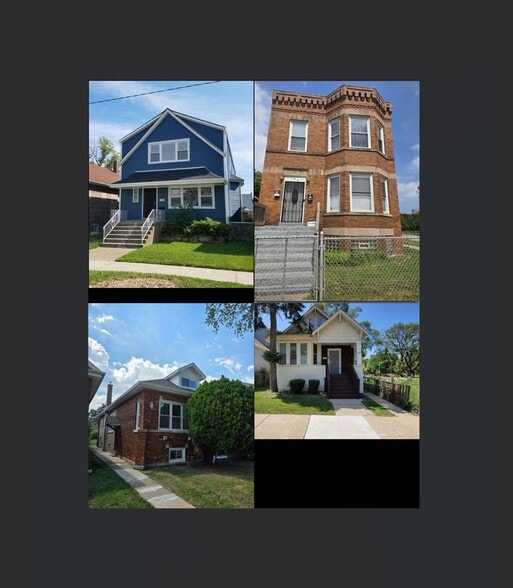
91 SFR/Multi Portfolio | 24% CoC 2 Multifamily Properties Offered at $14,545,220 in Chicago, IL
INVESTMENT HIGHLIGHTS
- Institutional scale, sensible mix 91 properties across Chicago: 63 SFRs, 21 two-flats, two 3-flats, one 4-unit, one 6-unit, one 8-unit, and two condos
EXECUTIVE SUMMARY
Offering Overview:
Institutional-scale, scattered-site 91-property Chicago portfolio delivering durable in-place cash flow and multiple exit paths. Asset mix: 63 Single-Family Homes, 21 Two-Flats, two 3-flats, one 4-unit, one 6-unit, one 8-unit, and two condos. Properties are located across established working-class neighborhoods, offering both diversification and operational efficiencies at scale.
Pricing & Returns (Modeled)
The portfolio is priced to a 12% unlevered cap rate on in-place rents using a conservative 30% operating expense ratio. With standard financing assumptions (80% LTV, 6.5% fixed, 30-yr amortization), underwriting indicates a mid-to-high-20% portfolio-level cash-on-cash return (illustrative; buyer to confirm with lender). Detailed, line-item modeling available; seller provides a dynamic Excel workbook that updates automatically if assumptions or price are adjusted.
Tenant & Revenue Profile
Blend of market-rate and voucher-backed (CHA/HCV) tenancies provides a stable collections base with embedded rent-growth opportunities. Current rent roll and taxes by property are available; buyer can underwrite with the provided 30% OpEx framework or apply a property-level expense view as preferred.
Investment Highlights
• Scale & Diversification: 91 assets spanning SFR and small multis (2–8 units) reduce single-asset volatility and smooth cash flows.
• 12% In-Place Cap (Modeled): Based on current rent roll and a conservative expense load (30%).
• Attractive Leverage Spread: Example financing (80% LTV @ 6.5% / 30 yrs) supports ~mid-/high-20s CoC at the portfolio level.
• Operational Efficiencies: Route-based maintenance, standardized turns, bulk materials, and centralized collections.
• Multiple Exit Paths: Long-term hold for yield, cash-out refinance upon stabilization, or break-up strategy (selective dispositions of higher-performing assets).
• Low Relative Basis: Entry pricing supports resilience, optional capex, and flexibility in strategy across sub-portfolios.
• Transparent Underwriting: Dynamic model shows Annual Rent, NOI, Sale Price, Loan Amount, ADS, CF After Debt, Equity, and CoC per asset and in aggregate; summary totals are filter-aware.
Value-Add Levers
• Rent optimization as leases roll; align below-market units to comps.
• Light CAPEX to improve finishes/curb appeal where warranted to support rent deltas.
• Expense controls: Vendor consolidation, bulk purchasing, and preventive maintenance cadence.
• Utility recapture (where feasible): Implement RUBS or structured passthroughs to reduce owner-paid expenses.
• Tax strategy: Review and appeal opportunities on a rolling basis (tax year and amounts provided per asset).
Underwriting Assumptions (for reference)
• Cap rate shown is unlevered (NOI ÷ Price) and excludes debt service.
• NOI modeled with a 30% expense ratio on collected rents (simple, conservative proxy).
• Illustrative financing example is not a loan commitment; buyer to underwrite with their own rate, fees, and reserve policies.
• Capex, taxes, insurance, and reserves should be underwritten per buyer standards; detailed property-level taxes are included for transparency.
Process & Access
• Portfolio offered as a single package; seller may consider reasonable carve-outs or staged closings subject to pricing/terms.
• Data room access (rent roll, taxes, dynamic underwriting workbook) available upon NDA and proof of funds.
• Drive-by tours and grouped interior access can be scheduled for qualified investors.
• Buyer to verify all information independently; no representations or warranties are made outside of the purchase agreement.
Contact
For the full model, rent roll, and diligence materials, please inquire. Seller can provide the dynamic Excel where you can adjust price, rate, LTV, or expense assumptions and see portfolio return metrics update instantly.
TAXES & OPERATING EXPENSES (PRO FORMA - 2025) Click Here to Access |
ANNUAL |
|---|---|
| Gross Rental Income |
$99,999

|
| Other Income |
-
|
| Vacancy Loss |
-
|
| Effective Gross Income |
$99,999
|
| Taxes |
$99,999
|
| Operating Expenses |
$99,999
|
| Total Expenses |
$99,999
|
| Net Operating Income |
$99,999
|
TAXES & OPERATING EXPENSES (PRO FORMA - 2025) Click Here to Access
| Gross Rental Income | |
|---|---|
| Annual | $99,999 |
| Other Income | |
|---|---|
| Annual | - |
| Vacancy Loss | |
|---|---|
| Annual | - |
| Effective Gross Income | |
|---|---|
| Annual | $99,999 |
| Taxes | |
|---|---|
| Annual | $99,999 |
| Operating Expenses | |
|---|---|
| Annual | $99,999 |
| Total Expenses | |
|---|---|
| Annual | $99,999 |
| Net Operating Income | |
|---|---|
| Annual | $99,999 |
PROPERTY FACTS
| Price | $14,545,220 | Status | Active |
| Price / SF | $1,008 / SF | Number of Properties | 2 |
| Sale Condition | Bulk/Portfolio Sale | Individually For Sale | 0 |
| Cap Rate | 10.79% | Total Building Size | 14,432 SF |
| Sale Type | Investment | Total Land Area | 0.33 AC |
| Price | $14,545,220 |
| Price / SF | $1,008 / SF |
| Sale Condition | Bulk/Portfolio Sale |
| Cap Rate | 10.79% |
| Sale Type | Investment |
| Status | Active |
| Number of Properties | 2 |
| Individually For Sale | 0 |
| Total Building Size | 14,432 SF |
| Total Land Area | 0.33 AC |
PROPERTIES
| PROPERTY NAME / ADDRESS | PROPERTY TYPE | SIZE | YEAR BUILT | INDIVIDUAL PRICE |
|---|---|---|---|---|
| 7933-7935 S Essex Ave, Chicago, IL 60617 | Multifamily | 8,232 SF | 1929 | - |
| 7831 S Colfax Ave, Chicago, IL 60649 | Multifamily | 6,200 SF | 1918 | - |
1 1

1 of 2
VIDEOS
MATTERPORT 3D EXTERIOR
MATTERPORT 3D TOUR
PHOTOS
STREET VIEW
STREET
MAP

1 of 1
Presented by
91 SFR/Multi Portfolio | 24% CoC
Already a member? Log In
Hmm, there seems to have been an error sending your message. Please try again.
Thanks! Your message was sent.