Internal Rate of Return Explained for Real Estate Investors

What is Internal Rate of Return (IRR)?
Internal rate of return is the discount rate that makes the net present value (NPV) of an investment zero. It measures the time adjusted return of an investment by considering cash flows over time.
IRR in Investment Analysis
IRR shows the annual growth rate an investor can expect. It sets future cash inflows and outflows on a comparable scale, making it easier to compare different projects.
IRR in Real Estate
IRR is used to assess cash flow patterns like rental income, capital improvements, and property disposition. It helps investors evaluate different property types and determine how long they must hold an asset for a good return. This method is a common tool in CRE investments, aiding investors in comparing the performance of commercial properties.
When applying IRR to real estate, it's important to consider the unique cash flow patterns of different property types. For example, multifamily properties offer steady rental incomes. Understanding these nuances helps investors tailor their analysis to each asset class.
Take a look at current property listings in your area to see real-world examples of how IRR applies to your investments.
Commercial Real Estate For Sale
When to Prioritize IRR
IRR is best when comparing projects with different sizes. It is also useful when you want to see the rate at which an investment grows over time. However, always check NPV and other metrics for a more balanced view.
Internal Rate of Return Formula
The internal rate of return is defined as the discount rate that sets the net present value of all cash flows to zero. In other words, it is the rate (r) that satisfies the following equation:
- CFt: Net cash flow in period t
- C0: Total initial investment costs
- IRR: The internal rate of return
- t: The number of time periods
Calculation Methods and Excel Tools
Manual Calculation Methods
Manually calculating IRR involves trial and error. You test different discount rates until you find one that brings the net present value to zero. This method works well for simple cash flow patterns.
Excel Tools for IRR Calculation
Excel offers built in functions to calculate IRR quickly. These tools simplify handling regular and irregular cash flows. If errors arise, verify your cash flow inputs and formulas.
A Real Estate IRR Calculation Example

This case study demonstrates how trial discount rates help determine the IRR. Investors frequently use IRR calculators to streamline this process and test multiple scenarios quickly. We use a step by step approach with a five year cash flow model.
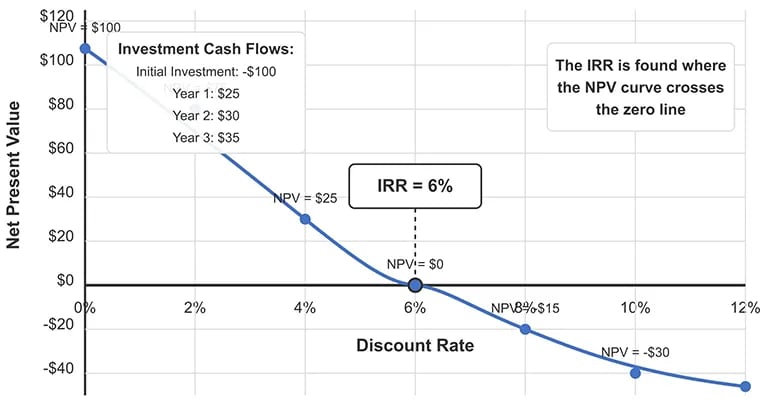
Consider an investment with an initial outflow of -$100, followed by annual cash inflows of $25, $30, $35, $40, and $45. The goal is to find the discount rate (IRR) that makes the net present value equal to zero.
First, try a discount rate of 10%. At this rate, the sum of the discounted cash flows is negative, meaning the rate is too high.
Next, test a lower rate of 2%. This produces a positive NPV, indicating that the rate is too low.
Through additional trials, testing rates like 7% and 5%, the calculation converges around 6%, where the net present value comes very close to zero. This 6% is the IRR for the investment.
This example shows how the trial and error method helps pinpoint the correct discount rate, offering a concrete insight into how IRR is derived. The same process applies across property types; for example, industrial properties often provide stable long term returns, allowing investors to adjust for the unique cash flow characteristics of these assets.
Finding IRR: Net Present Value at Different Discount Rates
What is IRR Used for?
Investment Evaluation and Decision Making
IRR is a versatile metric used to compare the performance of various real estate investments. For example, office buildings are often evaluated for their flexible leasing structures. This analysis supports informed decision making across the property sector.
Applications of IRR
- Capital Planning: Companies use IRR to compare options like building new facilities versus expanding current ones.
- Project Evaluation: IRR is useful for short term projects but may be less effective for long term ones where discount rates vary.
- Corporate Stock Buybacks: IRR determines if repurchasing shares offers better returns compared to expansion or acquisitions.
- Insurance Policy Evaluation: IRR helps individuals compare policies with identical premiums; higher IRR policies are more attractive.
- Investment Return Analysis: IRR is used to analyze returns, especially when evaluating reinvested dividends versus taken as income.
- Money-Weighted Rate of Return: IRR factors in all cash flow changes during the investment period.
For a broader view of property performance, other metrics can also be valuable. For example, our cash on cash return calculator helps compare investments by showing the cash income relative to the total cash invested.
To connect theory with practice, explore current nearby office space for sale listings and see how these investment principles apply in your local market.
Office Space For Sale
What Is a Good Internal Rate of Return?
A good IRR depends on the cost of capital and the opportunity cost of the investor. It must exceed the minimum return required to justify an investment.
Benchmarking IRR
Investors compare IRR against market rates and other opportunities. An IRR that exceeds the cost of capital often indicates a sound investment.
Context and Project Type
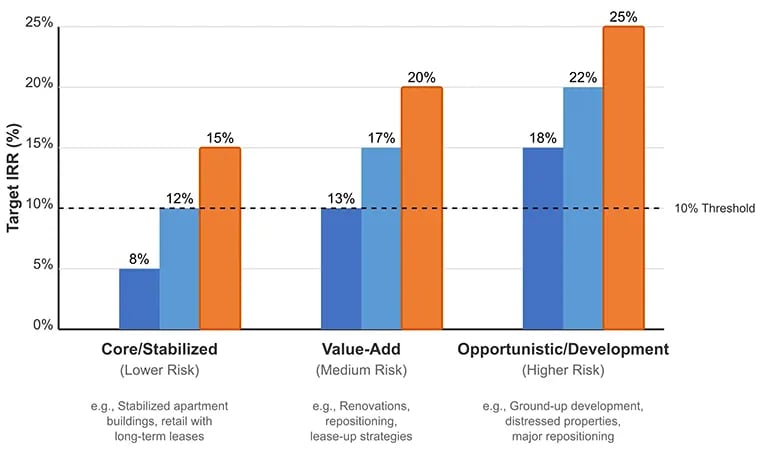
Different projects have different target IRRs. For example, stabilized properties may have lower targets compared to development projects. Adjust your expectations based on market conditions and project risk.
Expected IRR Ranges by Risk Profile in Commercial Real Estate
Rate of Return vs. Internal Rate of Return
Most investors start with rate of return (RoR) because it’s a simple way to measure total gain as a percentage of cost. But RoR doesn’t account for time.
IRR improves on this by factoring in exactly when cash flows occur. That’s why IRR is considered a time weighted measure, it tells you how fast your investment grows year over year.
IRR Limitations and Technical Challenges
| Limitation/Challenge | Key Points | Implications |
|---|---|---|
| Basic Limitations | IRR only identifies the discount rate that sets NPV to zero, missing broader performance metrics. | May oversimplify complex investments. |
| Impact of Irregular Cash Flows | Irregular cash flows can result in multiple IRR solutions. | Complicates analysis for projects with inconsistent income patterns. |
| Development Project Challenges | Negative cash flows in early years may skew IRR calculations. | Leads to potentially misleading returns in projects with high upfront costs. |
| Dealing with Multiple IRRs | When cash flows shift from negative to positive or vice versa multiple times, more than one IRR may be calculated. | Alternative metrics like MIRR or NPV may be required for clarity. |
IRR vs. NPV and Other Investment Metrics
| Metric | Key Benefits | Best For |
|---|---|---|
| IRR | Provides a clear percentage return over time | Comparing projects with different sizes |
| NPV | Shows the dollar value added by an investment | Evaluating absolute profitability |
| Cost of Capital | Benchmarks project returns against financing costs | Deciding if an investment meets return requirements |
| Yield on Cost | Measures relationship between stabilized NOI and total project costs | Development projects and value add investments |
| MIRR | Eliminates multiple IRR issues with a single reinvestment rate | Investments with irregular cash flows |
Key Differences Between IRR and NPV

IRR provides a percentage return while NPV shows the dollar value of an investment's profitability. IRR helps compare projects by offering a rate, whereas NPV tells you how much value is added.
NPV is calculated by subtracting the present value of cash outflows from the present value of cash inflows. A positive NPV indicates that an investment is expected to add value over time.
Cost of Capital vs IRR
IRR is a measure of the investment's return over time, expressed as a percentage. Cost of capital is the minimum rate needed to fund a project.
If the IRR exceeds the cost of capital, the investment is generally attractive. When the IRR is lower, the project may not generate enough return to cover its financing costs.
Comparing IRR and cost of capital helps investors decide which projects are worth pursuing. This analysis ensures that only investments that beat the financing benchmark are considered.
Combining Multiple Metrics for Analysis
Investors use IRR alongside NPV, a gross rent multiplier calculator, and even a commercial property cap rate to get a complete picture. For investors in syndications or partnerships, adding financing cash flow analysis to that toolkit shows whether the debt and equity transactions underpinning the IRR projection are materializing as modeled at the entity level.
Each metric has its strength, so using them together minimizes potential errors.
Modified Internal Rate of Return
MIRR is a variation of the traditional IRR. It assumes reinvestment of cash flows at a realistic rate.
Differences from Traditional IRR
MIRR eliminates issues of multiple IRR solutions by using a single reinvestment rate. This approach provides a clearer picture of an investment's return.
Applications in Real Estate
Real estate projects with uneven cash flows benefit from MIRR analysis. It offers more reliable insights into investments with significant capital improvement needs.
When to Use MIRR
MIRR is especially useful when cash flows are irregular. It serves as a better basis for comparing property types and investment strategies.
Frequently Asked Questions About IRR
How can I determine if an IRR calculation is reliable when evaluating a real estate investment?
To determine if an IRR calculation is reliable, check three key factors. First, verify that cash flow projections are realistic and well documented. Next, ensure that the cash flow pattern does not change direction more than once, which could create multiple IRR solutions. Finally, compare the IRR with similar properties in the market to see if it falls within a reasonable range. If any concerns arise, use additional metrics like MIRR or NPV for a more complete analysis.
What's a good IRR target for different types of real estate investments?
Target IRRs vary by property type and risk level. Core properties (stabilized) typically target 8-12%, value add properties aim for 13-17%, and opportunistic or development projects often require 18% or more to justify the higher risk. These targets should be adjusted based on market conditions, interest rates, and your cost of capital, and compared against alternative investment returns.
Closing Thoughts
While IRR shows the percentage return on an investment, it does not capture the total dollar profit. A project with a lower IRR may still generate a higher absolute return if it involves a larger scale of investment.
Sometimes, projects with low IRR are justified by factors beyond the numbers, such as regulatory requirements, strategic positioning, or long term growth plans. Evaluating these elements alongside IRR offers a more complete view of an investment's potential.