Is There Demand for Coworking Space? Investor Outlook
Key Takeaways
- Coworking demand is rising. Inventory reached about 8,400 locations and 152 million square by Q3 2025, but is still only 2% of the office market, signaling room to grow.
- Location matters. Suburban coworking expanded by roughly 58% vs. 4% in urban markets since 2023, while secondary markets and regional corridors now drive growth and retention.
- Pricing is regional. Northeast tier-one often supports highest-cost memberships, followed by the South and Midwest, then Mountain and Southwest regions. Match pricing to local wages and competitors to lift RevPAD.
- Corporate adoption is reshaping demand. Enterprise clients account for 27.6% of users and may require longer membership terms, improving revenue stability for coworking spaces.
With the rise of hybrid and remote work, coworking spaces fill a need for flexible workspaces for individuals and companies alike. But demand isn't spread evenly across locations or asset types.
As an investor, a key element to improving coworking space margins, regardless of the type of coworking space you open, is choosing an asset where demand will stay steady or increase, driving membership growth.
Is Coworking Demand Growing?
Growth rate, supply increase, and regional metrics point to sustained growth.
Since 2020, demand for flexible workspaces has increased 19% in the U.S. and Canada. And supply has steadily increased with that demand.
Coworking inventory topped 8,400 locations and 152 million square feet as of Q3 2025, up from about 7,500 locations and 133.5 million square feet in Q3 2024, according to CoworkingCafe.
Coworking inventory by square footage has grown consistently from 2024 into 2025, but coworking still only represents 2% of the overall office market. Data compiled from CoworkingCafe quarterly reports.
Despite that growth, coworking still only represents about 2% of the office market. That, coupled with projected global market growth from $22 billion in 2024 to over $82 billion by 2034 indicates early-stage expansion, and an opportunity for investors to position themselves ahead of the curve with the right asset choice. Coworking spaces are well situated to capitalize on workplace transformations as enterprise and small operators alike shift toward flexible workspaces.
What's Driving Demand for Coworking Spaces?
Remote and hybrid work are creating durable demand.
Shifts toward hybrid work are creating two distinct audiences for coworking spaces: Individual remote workers who need professional environments outside their homes, and corporations looking for satellite offices to support hybrid teams.
As more companies adopt hybrid schedules, their employees are increasingly likely to turn to coworking spaces as a functional space to work. But demand has expanded beyond individual employees.
Corporate teams represent 27.6% of coworking clients, and one study found that, of businesses planning to expand their operations in the next two years, 59% expected to use flexible workspaces to do so. That can dramatically change the risk profile of a coworking asset: Corporate clients with longer-term memberships add stability that might previously have been lacking from dozens of individual members.
Coworking as a "third place" builds community and retention
One of the key differentiators for coworking spaces is the community aspect. While hybrid and remote workers could make do with a public space such as a coffee shop, oftentimes they're looking for spaces that provide opportunities for connection and collaboration, not simply a desk. That desire helps drive the demand for coworking spaces, and it's worth keeping in mind as you plan for the costs to open a coworking space.
Coworking capitalizes on that need with structured environments, networking opportunities, and community programming. Don't make the mistake of assuming those are soft benefits without any bottom-line impact. They translate into member retention rates that determine whether a coworking investment generates stable returns or constant tenant turnover.
Community development not only improves retention and justifies premium membership pricing, it also acts as a moat that's difficult for competitors to replicate. A new coworking space can copy your floorplan and pricing, but if your members are part of an established community, they're significantly less likely to leave your location. Evaluate this during due diligence by requesting member retention data by membership type, and look for annual retention above 70%.
Understanding what drives coworking demand helps identify where that demand concentrates geographically.
Where is Coworking Demand Growing?
Suburban coworking expansion is accelerating and outpacing urban markets.
Suburban markets in particular are seeing sustained growth: From January 2023 to January 2025, coworking space grew by 58%, compared to just 4% growth in urban markets, according to one study. Suburban coworking space expanded from approximately 55.5 million square feet in 2023 to over 68.2 million square feet in 2024, and is projected to surpass 87.6 million square feet in 2025.
Suburban coworking inventory is projected to exceed urban inventory by 2025, reflecting shifts in workplace location preferences. Data from Yardi Kube.
As an investor, that data offers an insight into how to target assets in either market. Suburban markets attract members through easier access and more convenient commutes, and they can sustain lower occupancy thanks to reduced tenant acquisition costs and longer memberships.
Urban assets will rely on density and transit access, and need higher occupancy to cover operating costs. To pressure-test local demand, review live coworking spaces for lease in your target market to compare formats, rates, and availability.
Secondary markets now drive national coworking growth, and regional corridors amplify demand.
Just as coworking development is accelerating in suburban areas, secondary markets are expanding while coastal markets stay flat or decline. For example, suburban Dallas coworking space grew by 40%, from 4.5 million square feet in 2023 to more than 6.3 million square feet in 2025. Compare that with New York City, which contracted from 16.7 to 14.8 million square feet over the same time frame.
Population and business formation data further support secondary market expansion. Dallas-Fort Worth added about 178,000 residents and the Phoenix-Mesa-Chandler metro area added nearly 85,000 between 2023 and 2024. They also lead in net business formation, creating a market of small companies and startups most likely to rely on coworking spaces.
Data from Q3 2025 points toward a trend of regional expansion, where coworking assets in cities near each other expand simultaneously. Again, Texas is a prime example: Dallas, Houston, Austin, and San Antonio form a regional hub that now hosts more than 600 flexible workspaces.
By creating an interconnected system of coworking hubs to support larger member bases, operators can take advantage of growing demand while also adding value for members.
These distinctions can have a significant impact on your returns. Lower purchase prices in secondary markets means you're better equipped to handle vacancy, compete on membership price, and recoup more profit when you exit. Meanwhile, markets in emerging corridors are more likely to sustain demand. A property in an expanding regional hub is likely to outperform a standalone asset in a larger market thanks to lower marketing costs and higher retention.
Regional pricing structures vary and impact profitability
Target membership pricing will vary depending on your local market. Northeast markets command premium pricing driven by density. Metros like New York City and Boston have high concentrations of high-income professionals, corporate satellite office demand, and limited alternative workspace options.
Southern and Midwestern markets, on the other hand, operate at lower monthly prices. These markets achieve profitability with lower occupancy costs, reduced staff ratios, and optimized space layouts. Use regional price bands as a proxy for demand intensity and attainable revenue per available desk (RevPAD).
| Region | Membership Band | Product Tilt | Underwriting Note |
|---|---|---|---|
| Northeast tier-one | $300-$340 | Private offices, enterprise suites | Price power supports RevPAD gains if churn stays under 3% monthly. |
| South and Midwest | $150-$235 | Efficient layouts, meeting room monetization | Focus on utilization, not rate, to hit break-even faster. |
| Mountain and Southwest | $200-$275 | Team rooms, flexible suites | Secondary nodes near residential growth outperform CBDs. |
Membership bands, product tilts, and underwriting needs will vary by market. Review your local market for the most accurate metrics.
Pricing elasticity across regions demonstrates that demand exists at multiple price points, allowing investors to match strategy to local market conditions. Revenue optimization will come from matching prices to local wage levels and competitive alternatives, so review coworking space for lease in your market to find comparable rates.
Coworking Spaces For Lease
Don't make the mistake of pushing prices higher than your market will support or you risk losing revenue as your occupancy drops and you lose out to competitors. A coworking space in Phoenix with an average $225 monthly membership at 80% occupancy will outperform a comparable asset trying to push $300 a month but falls to 55% occupancy.
What Do Market Trends Signal for Investors?
Compelled optimization signals a maturing market.
While year-over-year the number of coworking spaces nationwide increased, growth has slowed quarter-to-quarter in 2025, signaling a shift from rapid expansion to a focus on optimization and market selection.
For example, Manhattan saw its first quarterly contraction in 2025, with total flexible workspace down about 4% and locations down roughly 5%, while it still maintains the nation's largest average coworking footprint at just over 42,000 square feet per site.
Meanwhile, emerging markets such as Long Island and Birmingham saw increased coworking footprints. These trends signal a potential shift toward a focus on either optimizing in established markets or expanding in selective markets with proven demand rather than speculative expansion. In turn, that trend points to sustainable demand rather than speculative oversupply, as operators focus on locations with proven member bases.
For investors, this means acquisition opportunities concentrate in two areas: stabilized properties in growth markets where owners are looking to cash in on equity, and distressed assets in mature markets where operational improvements can optimize performance and generate returns.
Review financials for individual deals, and prioritize submarkets that can support 1.30 debt service coverage ratio (DSCR) or higher at 70% occupancy using current comps and high meeting room utilization. Optimization clusters in submarkets with resilient demand, guiding where to buy or expand. Use digital tools, like a DSCR calculator, to evaluate properties.
Geographic targeting narrows acquisition focus, but understanding your tenant mix determines underwriting assumptions.
How Is Corporate Use Shaping Coworking Demand?
Companies adopting hub-and-spoke models are using coworking as strategic satellite locations.
Corporate clients make up more than 27% of the coworking market, and coworking spaces are increasingly viewed as a viable option when companies want to expand. For investors, that means the tenant profile of a coworking asset could shift from purely individual members to a mix that includes creditworthy enterprise tenants looking for long-term commitments.
Corporations are more likely to sign agreements 12 months or longer and pay for multiple seats simultaneously. That drives down your marketing cost per occupied desk and gives you a revenue floor that reduces vacancy sensitivity in a downturn.
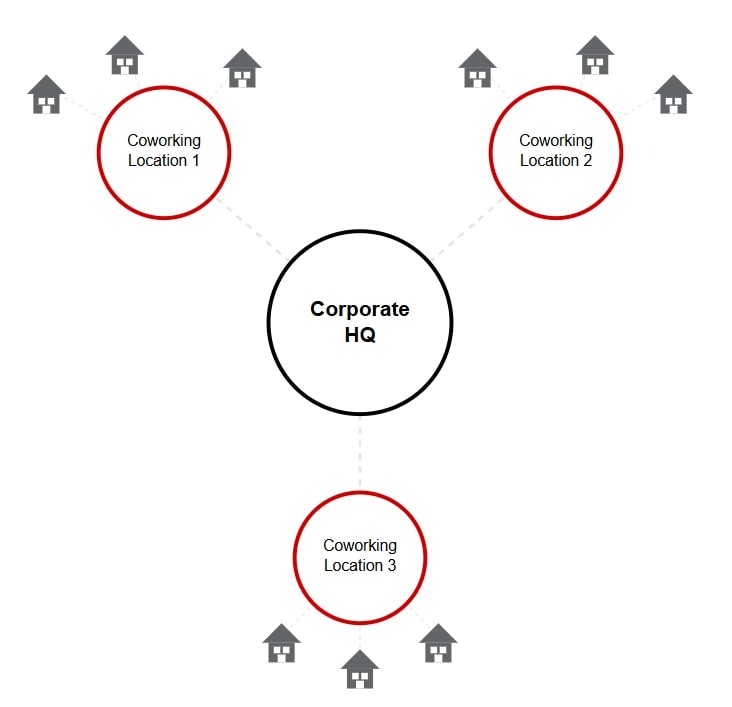
However, the way enterprise clients use coworking spaces will follow a different setup than individual members. Corporations are more likely to use a hub-and-spoke model, where they maintain a smaller headquarters, then purchase memberships at one or more coworking spaces to give employees collaboration space closer to their homes.
Enterprise clients look for different features than individual coworking members.
While enterprise clients will look for the hallmark advantages of a coworking space, namely flexibility, they'll also prioritize advanced access control, continuous security monitoring, fortified networking infrastructure, and seamless IT support to meet the needs of their clients and safeguard confidential data.
For an owner, this creates a split in the market. Traditional coworking will offer easily accessible WiFi, keycard access, and community management. Corporate-focused assets will need network segmentation, security monitoring, and dedicated IT resources to handle enterprise compliance.
Meeting enterprise specs is required to capture and sustain corporate demand. Budget for higher capital improvements at acquisition, but expect typically higher membership prices as a payoff.
Corporate use creates demand for office-coworking hybrids.
Some landlords are building flexible workspaces within traditional office buildings to offer upgraded common areas and additional conference rooms to current tenants, and target future tenants not yet ready to sign long-term leases.These landlord-led flex floors appear where tenant appetite for them is already evident, and reinforce submarket demand once they're operational.
For example, say you purchased a five-story office building for sale that already had tenants on floors one through three. If traditional tenants are still hard to secure after 18 months, you could convert the fourth floor into a coworking space with 80 dedicated desks, 20 hot desks, four meeting rooms, a kitchen, and two lounge areas.
In this scenario, the fourth floor would operate as a separate business within the building. Members swipe into and out of that floor exclusively, but traditional tenants on the first three floors might get access to the floor four conference rooms when they need extra meeting space.
For investors considering Class B or C properties, adding a coworking floor can be the difference between carrying a vacant level or turning it into consistent monthly revenue. A coworking component both monetizes underused space and strengthens the building's appeal to traditional tenants that prioritize flexible workspace for hybrid employees. Keep these factors in mind when considering office vs. coworking investing.
Office Spaces For Sale
Frequently Asked Questions
How does coworking demand vary by region in the United States?
Coworking demand shows significant regional variation across the United States. The Northeast maintains the highest density and pricing. Southern markets like Dallas, Houston, and Atlanta offer mid-range pricing while still experiencing robust growth. Midwestern cities like Columbus and Salt Lake City have created "efficiency markets" with lower price points that maintain profitability through optimization. The most dramatic growth is occurring in secondary markets like Dallas-Fort Worth, Atlanta, and Phoenix, which are outpacing traditional coastal hubs.
Is coworking demand sustainable long-term?
Yes, coworking demand shows strong indicators of long-term sustainability. The global coworking market is projected to grow from $22.01 billion in 2024 to $82.12 billion by 2034, representing a 14.1% annual growth rate.
Three structural factors support this trajectory: First, hybrid work models are becoming permanent workplace policies rather than temporary arrangements. Second, the industry has shifted from rapid expansion to operational optimization, signaling market maturation rather than speculative growth. Third, corporate teams now represent 27.6% of the coworking market, providing stable, long-term lease commitments that reduce the historical reliance on freelancers and startups.
While regional markets will experience different growth rates, the fundamental drivers represent permanent changes to how companies approach office space rather than cyclical trends.
What are the biggest risks in coworking investments?
Coworking investments face three primary risk factors that differ from traditional office assets. First, occupancy volatility stems from month-to-month membership agreements that allow members to cancel with 30 days' notice, creating unpredictable cash flow compared to multi-year office leases. Second, competition is intensifying as traditional landlords add flex floors to existing office buildings, potentially flooding submarkets with supply. Third, capital requirements can escalate when targeting enterprise clients who demand advanced security infrastructure, network segmentation, and dedicated IT support that traditional coworking spaces don't need.