Multifamily Break Even Analysis for Investors

Key Takeaways
- Break-even occupancy is the minimum occupancy rate your property needs to cover all expenses and debt service before losing money
- Improving efficiency, adding ancillary revenue, or refinancing can lower your break-even by several percentage points.
- Stress-test your metrics with mild to severe rent and expense shocks to see whether your property can withstand vacancies or downturns.
What Is Break-Even Occupancy in Multifamily Real Estate?
Break-even occupancy is the minimum percentage of occupied units needed for a multifamily property to cover all operating expenses and debt service without losing money.
Think of it as your financial safety line. No matter what type of multifamily home you invest in, if occupancy drops below this threshold, you're writing checks to keep the property afloat instead of collecting rent checks. A higher break-even occupancy rate is one of the primary benefits to consider when comparing multifamily vs. single-family rental roi.
This metric answers one of the most important questions you'll ask about any multifamily investing opportunity: How much vacancy can this property handle before I start bleeding cash?
The three components of break-even occupancy
Every break-even calculation requires three metrics:
- Operating expenses: Every cost required to run the building, from property management fees to taxes, maintenance, and upkeep costs.These are your year-round obligations regardless of how many units are occupied.
- Annual debt service: Your total annual mortgage payment, including both principal and interest.
- Gross potential income: The maximum rental revenue if every unit stayed occupied at current market rents for the entire year. This is your revenue ceiling before any vacancies, rent concessions, or collection losses.
How to Calculate Break-Even Occupancy
The formula is straightforward: Add operating expenses and annual debt service, then divide that sum by your gross potential income.
For example, let's say you're considering a 100-unit apartment building for sale in Dallas. It has operating expenses of $400,000 per year, annual debt service of $408,000, and gross potential income of $1.8 million.
First, add your expenses and debt service: $400,000 + $408,000 = $808,000. This is the minimum annual revenue you need just to break even.
Next, divide that total by your gross potential income: $808,000 ÷ $1,800,000 = 0.449, or 44.9%.
This means you need 45 of your 100 units occupied to cover all costs. That's a comfortable margin of safety, which is exactly what you want to see when evaluating a multifamily property for sale.
Why Property Size Changes Break-Even Dynamics
The difference between a small vs. large multifamily property dramatically affects how break-even occupancy impacts your risk exposure.
Larger properties often have more stable collections because income is spread across more leases. They can also spread fixed costs across more units, which can lower the break-even percentage.
Smaller assets may swing more with one vacancy, which can push the required occupancy higher. Building style and systems matter too. An older boiler or high insurance market can raise expenses and push the line up.
Common break-even analysis mistakes
Break-even occupancy might be a relatively straightforward formula, but some common mistakes can leave you with an inflated calculation.
Excluding capital reserves
Many new investors exclude capital reserves from their calculations, for example. Add your required reserves to operating expenses before you run the formula, or you'll underestimate your true break-even point.
Economic occupancy vs. physical occupancy
Another error is using economic occupancy instead of physical occupancy in your denominator. Economic occupancy accounts for rent concessions, delinquencies, and collection losses. Physical occupancy just counts filled units. Your break-even calculation should use gross potential income (100% physical occupancy at full rents), not effective gross income (actual collections after losses). This keeps the metric conservative and protective.
How Do You Use Break-Even Occupancy to Assess Investment Risk?
Compare break-even occupancy against market conditions and stress-test it under various scenarios.
Every market has a typical economic occupancy range, and it's important to evaluate your property in the context of your specific market. A 75% break-even occupancy might be healthy in one market, but disastrous in another.
Find the typical occupancy rate in your market over the past 10 years, and pay special attention to occupancy rates during market downturns.
For example, say you're considering a property with an 82% break-even occupancy. If it's in a market that currently has a 92% occupancy rate, then you have a 10-point cushion. But if that same market had an 85% occupancy rate during the last recession, the property has just a three-point buffer in a stress scenario. That puts you one bad quarter of turnover away from being underwater.
Review multifamily properties for sale in your area and consider your market's unique economic occupancy before buying.
Multifamily For Sale
Combine break-even with other metrics for a full risk picture
Break-even tells you how fragile your cash flow is, but it doesn't capture returns or leverage risk. Compare it against other key metrics, including cap rate, debt service coverage ratio (DSCR), and cash-on-cash return
- Cap rate evaluates the potential return on investment of a property. Pairing it with break-even helps you see whether a high-yield asset is also highly volatile.
- DSCR measures how easily a property can cover its debt service. If your DSCR is relatively low (lenders typically want at least 1.20), and occupancy rate is high, your margins are very thin.
- Cash-on-cash return measures ROI based on actual cash invested. Use it with break-even to see if higher returns justify added risk.
Use digital tools, such as a cap rate calculator, DSCR calculator, and cash-on-cash return calculator to ensure you're getting the full profitability picture of a property.
Stress-test your investment in different scenarios
Whether you're considering garden apartments for sale in Los Angeles or high-rise apartments for sale in New York, you need to stress-test your occupancy rate before you close. Build out a base-case scenario, then add mild, moderate, and severe stressors to determine if your investment can withstand market changes.
- Base case: Use current operating data to calculate break-even.
- Mild stress: Drop rents 5%, raise expenses 3%.
- Moderate stress: Drop rents 10%, raise expenses 6%.
- Severe stress: Drop rents 15%, raise expenses 8%.
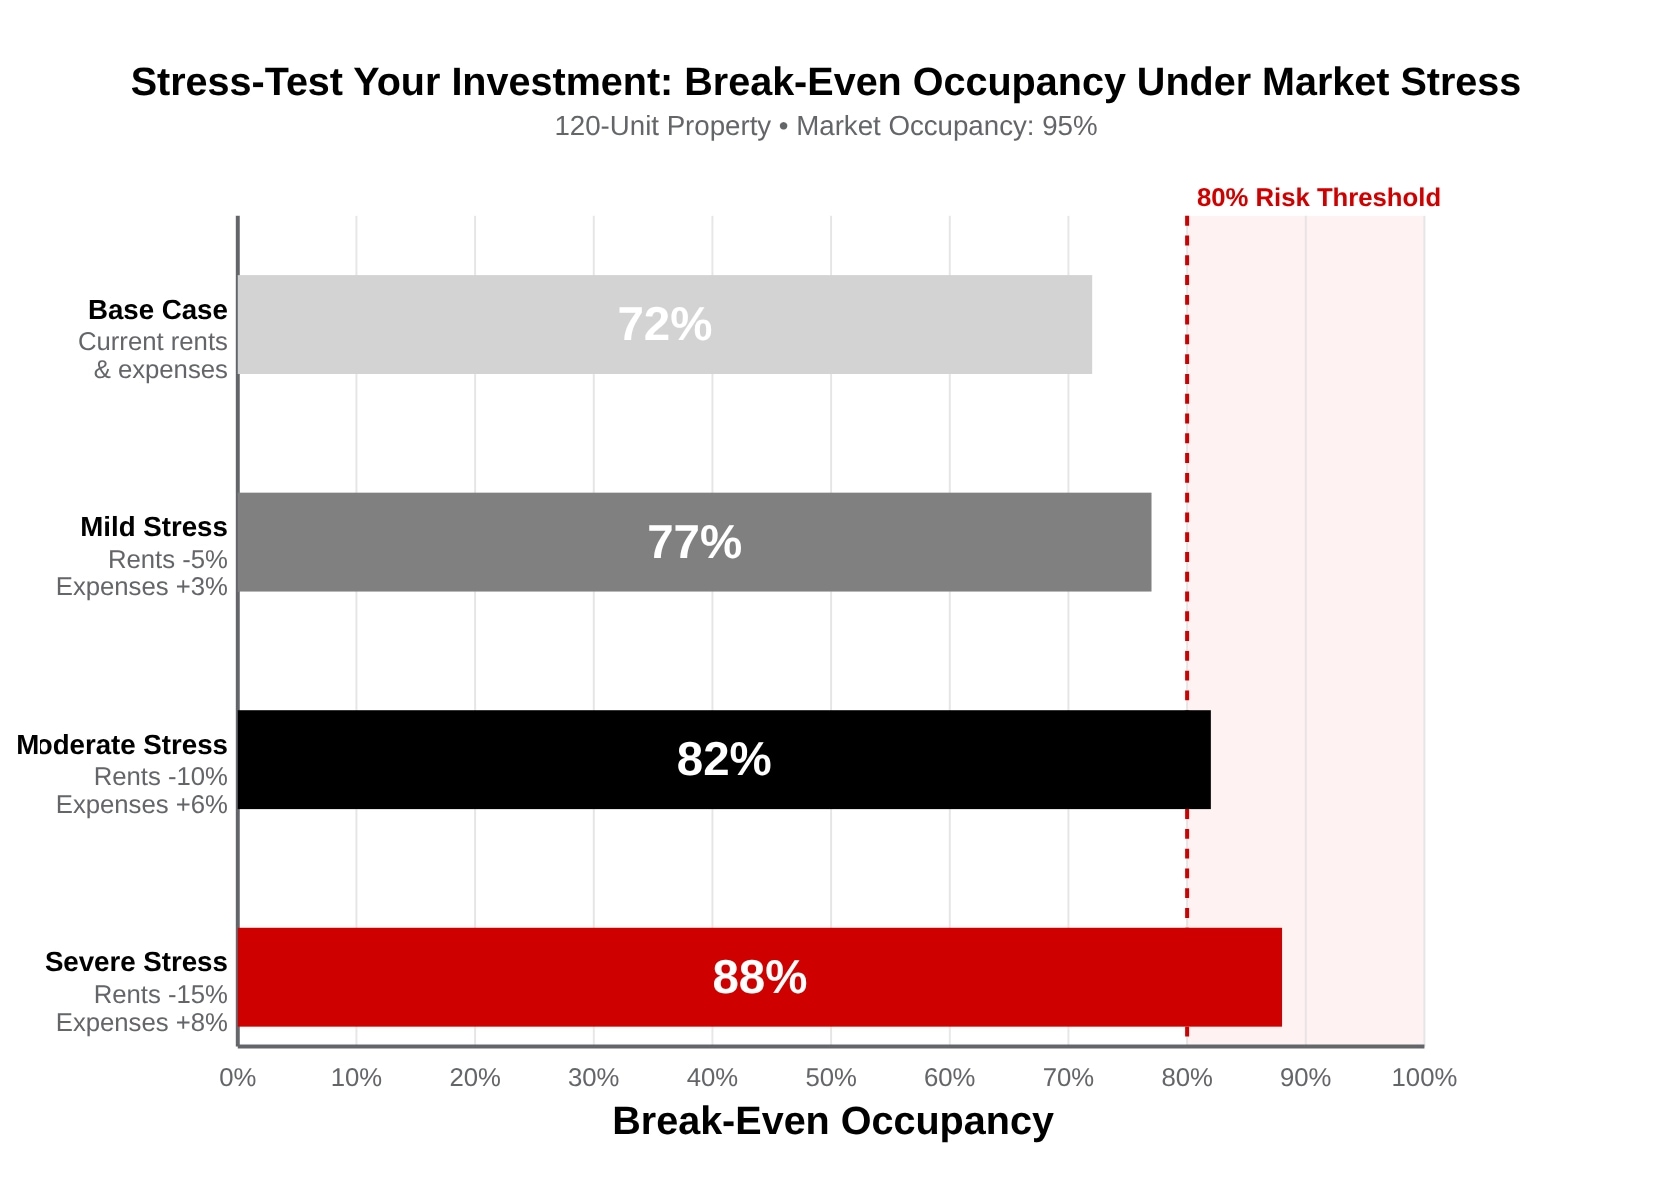
Recalculate the break-even occupancy each time. If moderate stress pushes your break-even near market occupancy, then the deal lacks resilience. Plan to either pass or negotiate to bring your expenses down.
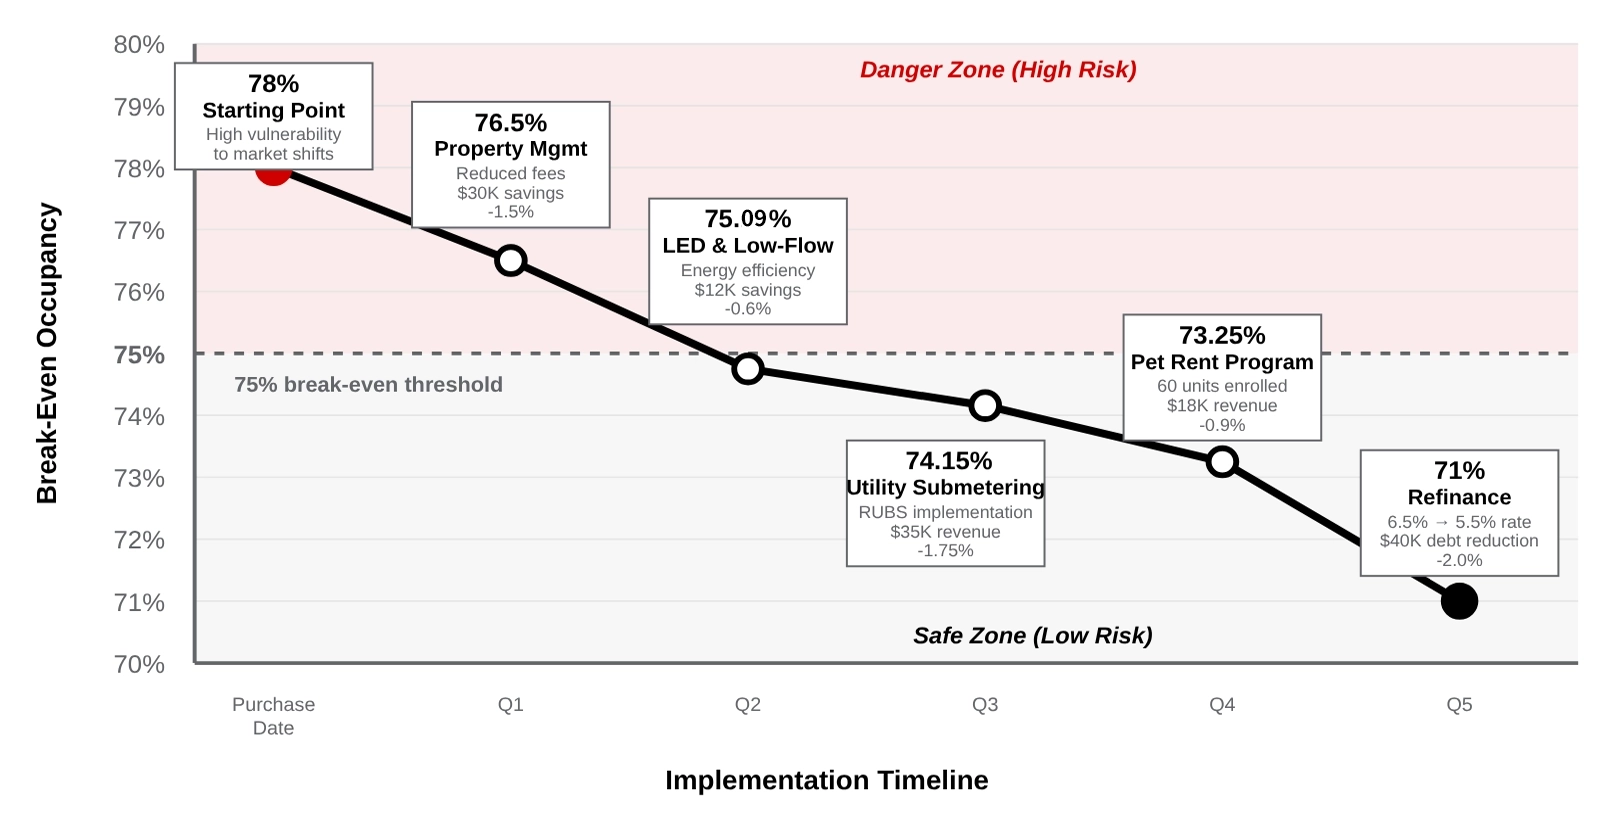
How Can You Improve Your Break-Even Performance?
Increase income and decrease spending without hurting tenant experience.
A lower break-even occupancy helps stabilize returns and gives you breathing room in slow markets. Look to improve operating efficiency, increase revenue aside from rent, and restructure debt.
Improve operational efficiency
Operating expenses are the largest lever under your control. Every dollar you save below the line widens your safety margin, and could be the difference between holding steady or bleeding cash.
Start with property management, maintenance and repairs, and utilities. Review your property management contract and see if there's room to negotiate down to a lower fee.
Next, look for systematic utilities improvements. Retrofitting lights with LED bulbs, adding low-flow water fixtures, and installing smart thermostats in shared spaces aren't glamorous improvements, but they can dramatically improve the efficiency of your building.
Stay on top of preventive maintenance to avoid costly emergency repairs later on. Properties that defer maintenance often show artificially low operating expenses in year one, then get hammered with emergency costs in years two and three. That volatility pushes break-even occupancy higher when you need stability most. The goal is to eliminate waste and improve efficiency, not put off maintenance that will cost more in the long run.
Increase revenue beyond rent
Raising rents may seem like the simplest way to increase revenue, but keep in mind that each market will have a limit. At some point the increases will lead to tenant turnover that eats into your revenue.
Look to options like installing individual utility meters to shift utility costs, implementing parking or storage fees, or adding pet fees and pet rent to push revenue higher without raising rents.
Aim to implement three to five revenue enhancements, rather than trying to extract everything from base rent. A property that adds ancillary revenue while keeping rents competitive will outperform a property that pushes rents to the market limit and loses tenants to turnover.
Find quality tenants
Your break-even calculations assume you're collecting rent from occupied units. But poor tenant selection can quickly derail that. Strong tenant screening reduces delinquencies and vacancies, which directly improves your actual occupancy versus your break-even threshold.
The solution starts before your tenants move in. Learn how to find good tenants and ensure you and your staff know how to screen tenants systematically. Establish consistent screening criteria including credit score minimums, income verification, and rental history to ensure you're leasing units to tenants who will consistently pay their rent.
Restructure debt
Small improvements in financing terms can have an outsized impact on your break-even occupancy. For example, refinancing from a 6.5% interest rate to a 5.5% interest rate reduces annual debt service by approximately 9-10% on your remaining balance. On a $4 million loan with a 25-year amortization, that's roughly $30,000 in annual savings.
You can also extend your amortization period to reduce your monthly payment, although this comes with a tradeoff of more total interest paid over the course of your loan.
Before you decide to refinance, consider the breakeven period of paying closing costs. If refinancing costs $40,000 but saves $35,000 annually, you break even in 13.7 months. After that, each month is pure break-even occupancy improvement.
What Is Break-Even Ratio and Why Does It Matter to Lenders?
Break-even ratio shows how much of your property's income goes to expenses and debt.
Lenders view break-even ratio as an early warning sign. It shows how far cash flow can fall before a loan becomes unstable. Break-even occupancy helps you evaluate vacancy risk, while break-even ratio helps lenders evaluate loan risk. Understanding break-even ratio alongside break-even occupancy gives investors and lenders a shared lens for evaluating financial resilience.
Break-even ratio uses a similar formula to break-even occupancy, but uses gross operating income instead of gross potential income.
Break-Even Occupancy vs. Break-Even Ratio
These terms sound similar but measure different aspects of the same risk question.
- Break-even occupancy tells you the minimum percentage of units that must be occupied to cover your expenses.
- Break-even ratio tells you what percentage of gross operating income goes toward covering expenses and debt service
Break-even ratio shows how much of every dollar collected disappears before you see profit. A 75% break-even ratio means $0.75 of every dollar goes to expenses and debt, leaving $0.25 for cash flow and reserves.
Both metrics use the same underlying numbers, just framed differently. Break-even occupancy helps you think about vacancy risk. Break-even ratio helps you think about expense efficiency and leverage. Most offering memorandums will show you one or both, and you should calculate whichever one they omit.
How lenders use break-even ratio
Lenders prefer break-even ratio to break-even occupancy because it accounts for actual revenue, not projected occupancy. It's easier to verify, and captures the complete picture of actual collected rent, operating expenses, and debt service.
Most conventional and agency lenders prefer break-even ratios of 85% or lower. Anything above that signals thin margins that make lending more risky.
| Lender Type | Typical Standards | Risk Approach |
|---|---|---|
| Conventional banks | Target around 1.25x DSCR and a break-even ratio near or below 85% | Favor steady cash flow, moderate leverage, and predictable performance |
| Agency lenders (Fannie Mae, Freddie Mac) | Standards tighten in high-leverage or volatile markets; require lower ratios for stability | Conservative underwriting driven by property class, market strength, and sponsor experience |
| Private and bridge lenders | May accept higher ratios (sometimes 90%+) in exchange for higher rates or shorter loan terms | Flexible for value-add strategies but exposes investors to greater downside risk |
How to present break-even analysis in your loan package
Presenting your break-even analysis clearly and professionally builds confidence with your lenders and signals to them that you're more likely to be a safe borrower.
Start with a summary table showing both break-even occupancy and break-even ratio. Include current figures, 12-month trailing figures, and projections for years one through five. Show the lender how the metrics improve over time as you implement your business plan, and include a sensitivity analysis to show how your break-even ratio responds to adverse conditions.
Borrowers who provide clean, transparent analysis tend to secure better rates and terms because they reduce perceived uncertainty.
Balancing leverage with break-even ratio
Every dollar you borrow increases your leverage. But that also increases your debt service and drives up your break-even ratio. The key is to find the balance between maximizing returns and managing risk.
For example, say you're considering a mid-rise apartment building for sale that costs $10 million and generates $800,000 in net operating income and $400,000 in operating expenses. You're considering three financing options:
| Loan Option | Loan-to-Value | Annual Debt Service | Break-Even Ratio | Cash-on-Cash Return |
|---|---|---|---|---|
| Option 1 | 65% ($6.5 million loan at 6% interest) | $505,000 | 75% | 8.4% |
| Option 2 | 75% ($7.5 million loan at 6.25% interest) | $584,000 | 82% | 8.6% |
| Option 3 | 80% ($8 million loan at 6.75% interest) | $627,000 | 86% | 8.7% |
The key question isn't simply which offers the highest return. It's which option best fits your unique situation and goals.
- Option 1 gives you more room to borrow later if you decide to renovate or pull out equity. This might be the best option if you want to prioritize stability and peace of mind. The 75% break-even ratio means the property can sustain adversity in a strong market without going cashflow-negative.
- Option 2 might be the best option for a new commercial real estate investor. It offers solid returns with reasonable break-even metrics and still gives some financial flexibility.
- Option 3 gives the least flexibility, but might still be viable for an experienced investor with substantial liquidity and other properties that can cover shortfalls if necessary. You can justify the increased risk because you have backup capital sources.
Keep in mind that break-even ratio has an impact on your future lending ability as well. Lenders underwrite based on current financials, so if your break-even ratio is above 85% because your debt service is particularly high, lenders likely won't refinance.
Lenders often consider debt yield in addition to break-even occupancy when sizing a loan. Unlike DSCR or break-even ratio, debt yield ignores interest rates and amortization, which makes it a clearer test of collateral strength. A higher yield means the property could pay off the loan faster if something goes wrong, and lenders typically look for yields above 8-10%, depending on market and asset class. Understanding debt yield can help you determine why a property that seems like a solid investment might face financing issues.
How Do You Model Break-Even Analysis Over Time?
Build your baseline, then stress-test with expense shocks and revenue disruptions.
Break-even occupancy isn't static. It changes every year as expenses increase and rents adjust. Successful investors don't just calculate break-even occupancy at acquisition, they model how it will change over the next five to ten years under realistic scenarios. Tracking break-even over time improves both ongoing operations and exit valuations.
Build your baseline
Start with your current break-even occupancy, then model how changes to operating expenses and income affect it.
Break-even occupancy trajectories diverge significantly based on rent growth assumptions. Properties where income grows faster than expenses become safer investments over time, while properties with weak rent growth relative to expense inflation become progressively riskier. This hypothetical example shows one property with strong rent growth (2.5% annual rent growth and 3.5% expense growth) compared to one with weak rent growth (1.5% annual rent growth and 3.5% expense growth).
Operating expenses typically increase 2-4% in stable markets. Property taxes, insurance, utilities, and labor costs tend to track with inflation, although larger jumps can happen with reassessments or hardening insurance markets. As a rule of thumb, project a 3.5% op-ex increase.
Gross potential income should increase 2-3% annually with rent growth. Use 2.5% rent growth as a conservative projection.
Stress-test your model
Once you have your base case established, see how it performs with mild, moderate, and severe stressors.
- Mild stress +5% expenses, -2% rent.
- Moderate stress +8% expenses, -5% rent.
- Severe stress +10% expenses, -10% rent or temporary vacancy from renovation.
You can also model more specific scenarios that can suddenly shift your break-even occupancy. For example, if you're considering a value-add property that you know will need repairs, you know that you're going to deliberately disrupt occupancy and expenses to reposition your asset. In this scenario, your break-even occupancy will increase dramatically during renovations, and stabilization may take longer that you initially thought.
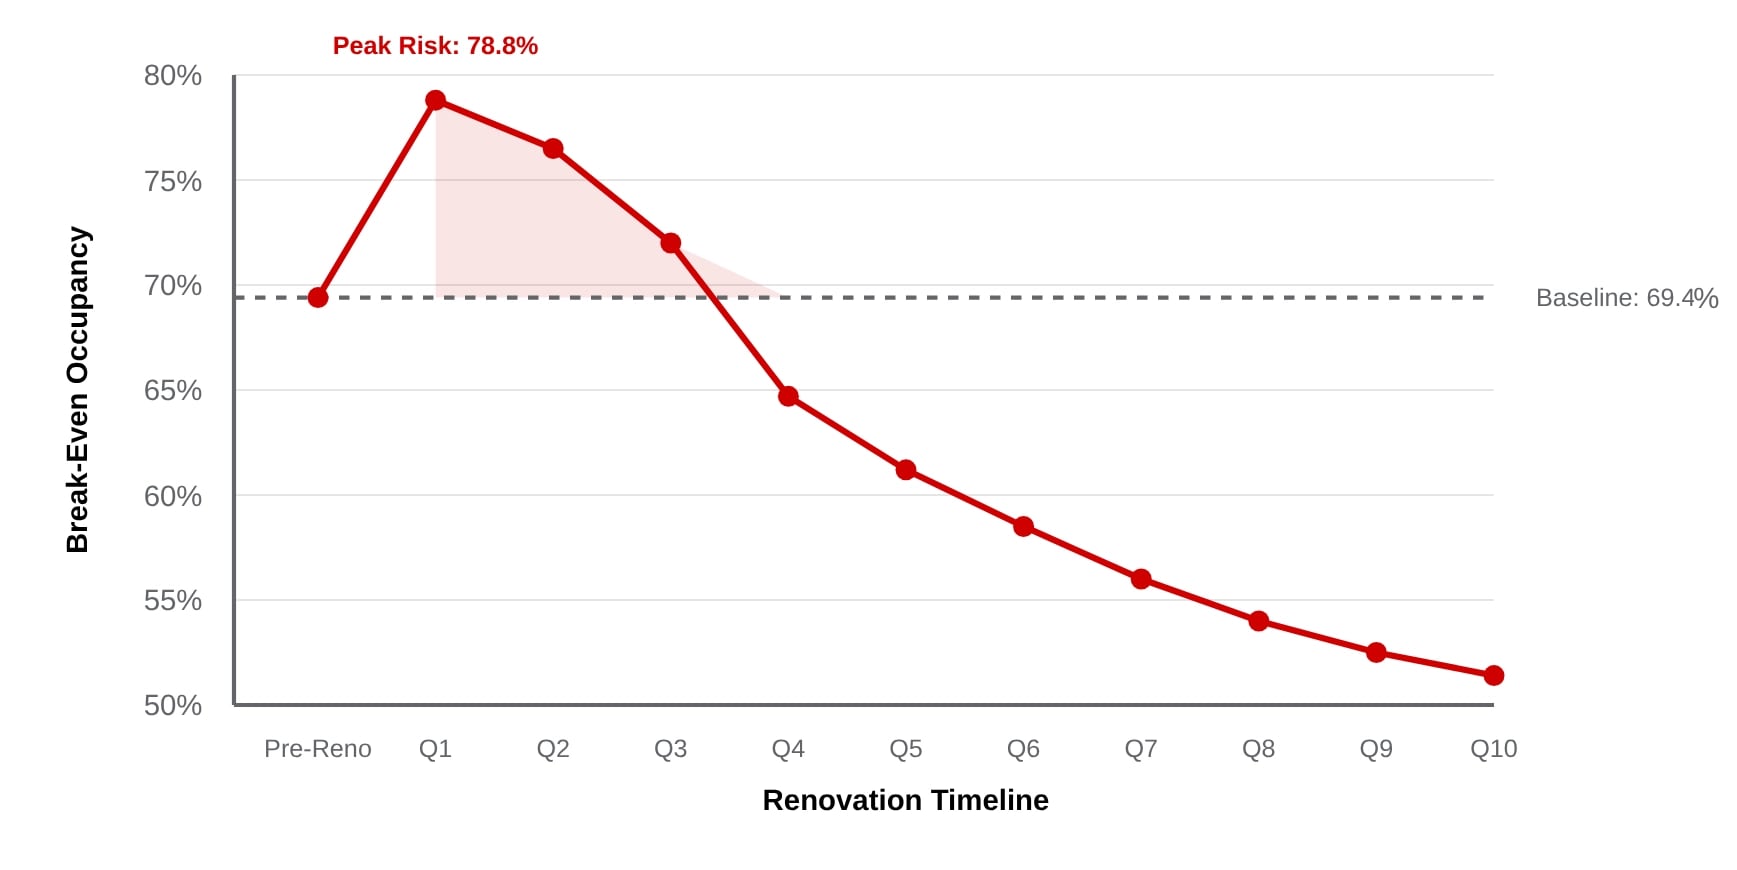
In that scenario, model the entire renovation timeline before you close and identify the worst quarter for break-even occupancy. Then ensure you have enough reserves to cover potential negative cash flow during that period.
Add similar projections for major capital expenditures, recession impacts, or property tax reassessments.
Create a personal monitoring dashboard
After you close, monitor break-even occupancy quarterly to find and fix small issues before they snowball.
In a spreadsheet, track:
- Actual occupancy rate
- Operating expenses
- Debt service
- Calculated break-even occupancy
Update it every month, then at the end of each quarter compare actual performance against your projections. Set medium and high alert thresholds so that, if actual occupancy drops more than expected, you notice quickly and can take action to fix it.
Track your break-even occupancy trend over rolling 12-month periods as well. If you notice multiple quarters of falling break-even occupancy, start paying attention to what's going wrong even if you're still generating cash flow.
Look for early warning signs
Watch for early signs that indicate break-even problems even before they show up in your financial statements and implement fixes before they cause lasting problems. Monitor these operational metrics because they signal break-even deterioration before it shows in your quarterly calculations.
| Early Warning Indicator | What It Signals | Immediate Action |
|---|---|---|
| Expenses growing faster than income for two consecutive quarters | Break-even occupancy is deteriorating. Your margin of safety is shrinking. |
Audit all expense categories to identify controllable costs. Determine if increases are property-specific or market-wide. Implement immediate corrections for controllable expenses. |
| Occupancy declining while market occupancy remains stable | Property-specific competitive problems. You're losing market position. |
Investigate the root cause of occupancy loss. Review pricing, unit condition, management responsiveness, and amenities versus competitors. Address deficiencies before the trajectory worsens. |
| Bad debt ratio increasing | Collection problems are increasing your break-even occupancy. | Strengthen tenant screening criteria. Accelerate collection processes. Issue pay-or-quit notices promptly. Review and enforce lease terms consistently. |
| Turnover rate rising | Lost rent during vacancy and higher turnover expenses are raising your effective break-even occupancy. | Implement tenant retention programs. Survey existing residents to identify problems. Improve property conditions and management responsiveness. Streamline the turn process to minimize vacancy days. |
| Emergency repair spending exceeds preventative maintenance spending, or maintenance spending falls below 2-3% of replacement cost annually. | Reactive rather than proactive maintenance approach. You're likely accumulating deferred maintenance that will become expensive emergencies. | Implement a scheduled preventative maintenance program. Compare your per-unit maintenance spending against industry benchmarks. Create a maintenance calendar for HVAC servicing, roof inspections, plumbing checks, and parking lot maintenance. |
Investors who ignore these early warning signs rarely catch problems in time. A small adjustment today can prevent a crisis six months from now.
Integrating break-even analysis with exit planning
Modeling your exit early ensures you acquire properties that will maintain or improve break-even metrics, making them more attractive to future buyers.
The monitoring and scenario planning you carry out as an owner will directly impact your ability to execute your exit strategy. If you can show strong break-even trajectories based on historical improvements, you're more likely to command premium valuations.
Model your hold period with the discounted cash flow method of valuation and include annual break-even occupancy in your projection tables. This demonstrates to buyers that you've maintained or improved the property's risk profile.
Similarly, your terminal cap rate assumptions should reflect break-even occupancy trends. A property with lower break-even occupancy offers a buyer more downside protection, even compared to a property with higher NOI but higher break-even occupancy as well.
Frequently Asked Questions
How does break-even occupancy change during a value-add renovation period?
During value-add renovations, break-even occupancy typically fluctuates due to changing income and expense dynamics. As units are taken offline for renovation, occupancy naturally dips, potentially pushing the property closer to its break-even threshold. However, as renovated units come back online with higher rents, the property's gross potential income increases, which can gradually lower the break-even percentage.
It's critical to model these fluctuations before acquisition and ensure sufficient capital reserves to cover potential negative cash flow during the renovation period. A well-structured value-add business plan should account for this temporary occupancy dip and demonstrate how the improved income post-renovation will establish a more favorable break-even occupancy than the property had pre-acquisition.
What strategies are most effective for lowering a property's break-even occupancy rate?
The most effective strategies for lowering break-even occupancy combine both income enhancement and expense reduction approaches.
On the income side: implement strategic rent increases based on market analysis, reduce delinquencies through improved tenant screening and collection processes, and add revenue streams through amenity fees, utility reimbursements, or service packages.
For expense management: negotiate better vendor contracts, implement energy efficiency upgrades to reduce utility costs, optimize staffing levels, and utilize preventative maintenance to avoid costly emergency repairs.
Additionally, refinancing to secure lower interest rates or better loan terms can significantly reduce debt service obligations. The ideal approach combines multiple strategies simultaneously, as even small improvements across several areas can dramatically lower your break-even threshold and increase your property's financial resilience.
How do lenders evaluate break-even ratios when underwriting multifamily loans?
Lenders typically evaluate break-even ratios alongside other key metrics like Debt Service Coverage Ratio (DSCR) and Loan-to-Value (LTV) when underwriting multifamily loans. Most conventional lenders prefer properties with break-even ratios of 85% or lower, as this provides a 15% cushion against market fluctuations. Agency lenders (Fannie Mae, Freddie Mac) may have stricter requirements in certain markets or for certain property classes.
When underwriting, lenders will often stress-test the break-even ratio by applying their own vacancy and expense assumptions, which may be more conservative than yours. They'll also analyze historical property performance to verify your projections. To strengthen your loan application, present a detailed break-even analysis that demonstrates the property's resilience under various market scenarios, highlighting any planned improvements that will further reduce the break-even ratio over the loan term.
How can I use break-even occupancy analysis to compare different multifamily investment opportunities?
To effectively compare investment opportunities using break-even occupancy analysis, start by calculating the break-even occupancy for each property. Then, compare each property's break-even occupancy against both current and historical occupancy rates in its specific submarket. Properties with break-even points significantly below market occupancy rates offer greater downside protection.
Next, create stress-test scenarios for each property by modeling how various economic conditions might impact occupancy and rents.
Finally, consider the spread between current/projected occupancy and break-even occupancy as a risk indicator. Larger spreads generally indicate less risk. Remember to contextualize this analysis with other metrics like cash-on-cash return and appreciation potential to develop a comprehensive risk-reward assessment for each opportunity, allowing you to identify investments that offer the optimal balance for your investment goals.