Rate of Return in Commercial Real Estate: How to Calculate, Analyze, and Improve Your Results

What is Rate of Return (RoR)?
Rate of Return (RoR) measures how much an investment has gained or lost over a specific period, expressed as a percentage of the original investment amount. It is one of the first numbers investors check because it shows, in simple terms, whether an investment made money or lost it.
RoR helps investors standardize performance across different types of investments. Whether it is stocks, bonds, or commercial real estate, the formula gives a common language for comparing opportunities. In commercial real estate specifically, RoR allows you to evaluate properties with very different income patterns, expense profiles, and risk levels.
However, not all returns are created equal. Short term gains might look impressive, but without adjusting for the holding period, taxes, or inflation, they can mislead you. That is why understanding the basic RoR is just the starting point. Sophisticated investors often move beyond simple RoR into deeper measures like internal rate of return (IRR) or discounted cash flow (DCF), especially when evaluating longer term real estate assets.
Rate of Return Formula
How to Calculate a Basic Rate of Return
RoR is calculated by measuring how much an investment's value has changed relative to its original cost. The basic formula subtracts the initial investment from the final value, divides the result by the initial investment, and then multiplies by 100 to express it as a percentage.
For example, imagine you purchased a commercial building for $2,000,000. After five years, you sell it for $2,500,000 and collected $300,000 in rental income during the holding period. Your Rate of Return would be:
This tells you that the investment delivered a 40% total return over the holding period before factoring in financing, taxes, or inflation adjustments.
Understanding RoR helps you build better comparisons between commercial properties, similar to how you might use a cap rate to quickly evaluate an income producing asset. It also ties directly into measuring commercial real estate values and understanding key metrics like net operating income.
Comparing Annualized vs. Cumulative Returns
To compare properties fairly, it is important to distinguish between cumulative and annualized returns. A 40% return over five years might seem impressive, but annualized returns reflect how consistently that return was earned each year. This matters when comparing projects with different time horizons or risk profiles.
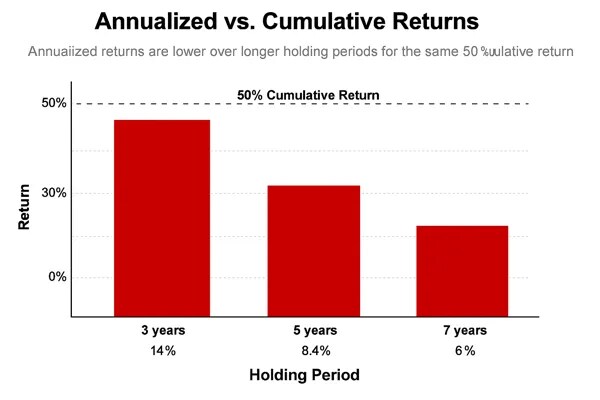
The table below shows how the same cumulative return looks when annualized over different holding periods:
| Holding Period | Cumulative Return | Annualized Return |
|---|---|---|
| 3 years | 30% | 9.1% |
| 5 years | 40% | 6.96% |
| 7 years | 50% | 5.91% |
Commercial properties often have irregular cash flows, with leases that escalate every few years or periods of vacancy. Adjusting for these variations helps create a more realistic return picture. Tools like a cash on cash calculator are especially useful when evaluating how much income you are generating based on the actual cash you invested.
Similarly, if you purchase a multifamily property and earn steady rental income over time, RoR calculations can help you project and compare long term returns across different markets.
Here are a few multifamily properties currently available, in case you're actively exploring investment opportunities.
Multifamily Properties For Sale
Factoring in Expenses and Cash Flow Timing
Simple RoR calculations assume clean income streams, but real world properties have operating expenses, capital expenditures, and sometimes downtime between tenants. For example, if your property had high repair costs or extended vacancies, your effective return would be much lower than the basic RoR suggests.
Other valuation metrics like gross rent multiplier and yield on cost can help you fine tune your investment analysis by accounting for operational realities.
In commercial real estate, understanding basic RoR gives you a starting point. But adjusting for time, cash flow variations, and operating performance turns a rough estimate into a real strategic tool.
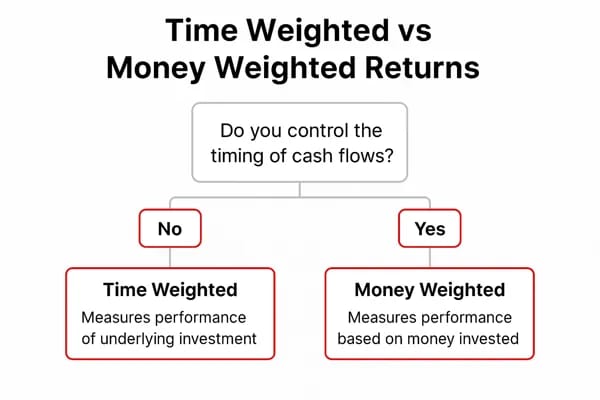
Understanding Time Weighted vs. Money Weighted Returns
In commercial real estate investing, how and when cash moves in and out of a property can significantly impact your returns. Time weighted and money weighted returns are two methods used to measure investment performance based on cash flow timing and control.
Time weighted return isolates the property's performance by removing the impact of additional contributions or withdrawals. It is ideal for comparing different investments side by side or evaluating a manager's ability to grow asset value independently of investor behavior.
Money weighted return, by contrast, captures the actual investor experience. It takes into account the size and timing of every cash flow, making it useful when evaluating strategies that involve multiple funding phases, refinancing events, or variable operating expenses.
Both time weighted and money weighted returns are specialized ways to calculate rate of return based on different assumptions. They help investors move beyond simple RoR formulas to understand how real-world cash flow patterns affect total performance over time.
| Aspect | Time Weighted Return | Money Weighted Return |
|---|---|---|
| Measures | Asset performance only | Investor's cash flow experience |
| Cash Flow Timing | Ignores contributions or withdrawals | Accounts for timing of all cash flows |
| Best Used For | Comparing investment performance across assets | Evaluating personal returns or phased projects |
| Example Scenario | Stabilized rental properties | Multi-phase developments or refinanced properties |
This table highlights why understanding the difference matters. Some real estate deals are better suited to one method over the other, depending on complexity and cash flow timing.
How Lease Structures and Financing Impact Returns
Commercial cash flows are rarely steady. Some leases pay quarterly, others escalate rents every few years, and vacancies can cause sharp drops. These fluctuations create bigger differences between time weighted and money weighted returns, depending on when cash enters or exits the deal.
Financing terms also influence return timing. Balloon payments, refinancing, or variable interest rates can distort simple return calculations. Building a discounted cash flow model helps account for these timing differences and provides a more accurate view of total investment performance.
Example: Development Projects with Capital Calls
Suppose you invest in a two phase industrial development. You contribute capital upfront for land acquisition, then make additional investments during construction. In this case, time weighted return would miss the impact of those staggered investments. Money weighted return captures each phase's timing and effect on your final results more accurately.
Choosing the right return method improves your ability to analyze complex commercial real estate deals. In longer term or multi-phase investments, reviewing both time weighted and money weighted returns together often gives the clearest performance picture.
Using IRR and DCF to Strengthen RoR Analysis
In many cases, especially simple purchases, RoR is all you need to evaluate success.
However, commercial real estate investments often involve multiple cash flows, holding periods that stretch over several years, and changes in income streams. In these cases, basic RoR can become misleading because it does not show when those gains or losses occur. This is where IRR and DCF come in. They help strengthen and refine your RoR analysis when simple percentage comparisons fall short.
| Metric | What It Measures | When It's Useful | Where It Falls Short |
|---|---|---|---|
| Rate of Return (RoR) | Total gain or loss as a percentage of original investment | Quick evaluation of simple investments | Ignores timing of cash flows |
| Internal Rate of Return (IRR) | Annualized return accounting for cash flow timing | Complex, long term, or phased investments | Assumes reinvestment at IRR, can distort in volatile markets |
| Cash-on-Cash Return | Annual pre-tax cash income relative to cash invested | Assessing near-term liquidity and income | Ignores appreciation and resale value |
| Cap Rate | Yield based on current net operating income | Snapshot comparisons between properties | Does not account for financing, cash flow changes, or appreciation |
How Internal Rate of Return Builds on Basic RoR
IRR extends RoR by factoring in the timing of every cash inflow and outflow. Instead of just showing the total return, IRR calculates the effective annual yield that sets all future cash flows equal to today's investment cost. Investors often use specialized IRR calculators to model multiple scenarios and compare different investment outcomes efficiently. In short, it answers: "What consistent annual rate would have produced these same results, given when the cash moved?"
If you hold a property for seven years, collect uneven rents, and sell at a gain, IRR shows the true yearly performance across the entire timeline. It refines the basic RoR into a more realistic, time sensitive metric.
How Discounted Cash Flow Supports RoR Analysis
DCF analysis uses a required RoR as the discount rate to value future cash flows. You estimate rental income, operating expenses, and sale proceeds, then discount those projections back to today's dollars. If the net present value (NPV) of the deal is positive, it means the investment is expected to meet or exceed your target RoR.
DCF turns RoR from a historical measure into a forward looking decision tool. Instead of just asking "What return did I get?", you start asking, "Will this property deliver the return I need?"
When to Bring IRR and DCF into Your RoR Analysis
In straightforward deals, RoR gives you a clean snapshot of performance. But in more complex situations, bringing IRR and DCF into the analysis can dramatically improve decision making. Examples include:
- Properties with uneven rental income or frequent tenant turnover
- Projects involving phased investments, renovations, or repositioning strategies
- Holding periods longer than five years, where compounding impacts grow larger
- Exit scenarios that depend heavily on market timing and sale price uncertainty
How Arithmetic and Geometric Averages Affect Rate of Return Calculations
When tracking RoR over multiple years, it matters whether you use an arithmetic or geometric average. Each method impacts how you interpret investment performance, especially when returns vary year to year.
Arithmetic Average Return Explained
Arithmetic averages add each year's return and divide by the number of years. For example, if a property earns 10%, 5%, and 15% over three years:
This method works for short term estimates but ignores compounding, which makes it less reliable over longer periods.
Geometric Average Return and Compounding
Geometric average return, also called compound annual growth rate (CAGR), accounts for compounding over time. It answers: "What steady return would match my final result?"
If an investment grows from $1,000 to $1,331 in three years:
In volatile markets, geometric averages are typically lower than arithmetic averages because compounding magnifies gains and losses.
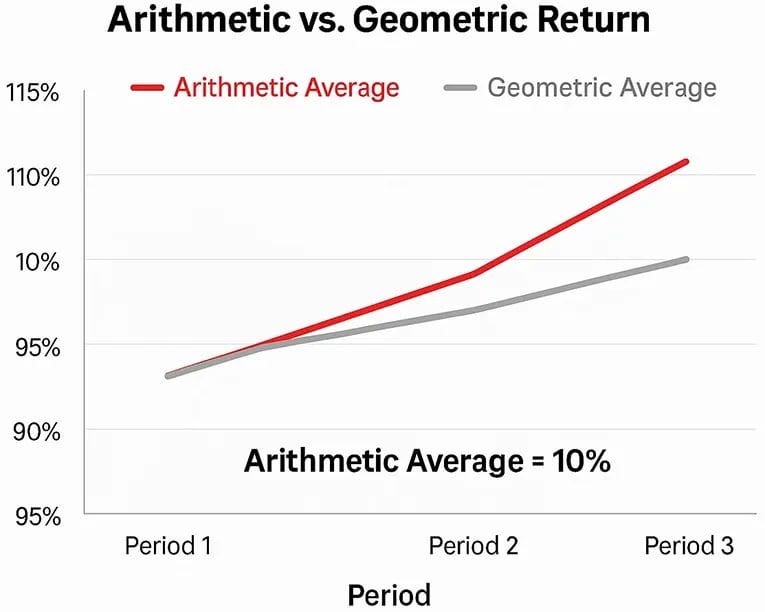
Why Geometric Averages Matter in CRE
Commercial real estate rarely produces stable returns. Lease turnovers, rent escalations, vacancies, and expenses all create volatility. Using geometric RoR gives a truer picture of real growth over time and avoids overestimating performance.
For accurate long term planning, especially for holdings beyond five years, calculating both averages strengthens your RoR analysis and highlights hidden risks.
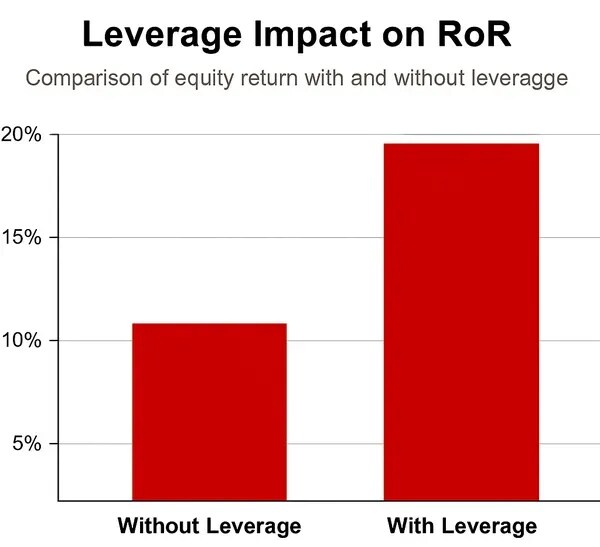
How Financing and Leverage Impact RoR Calculations
In commercial real estate, financing dramatically affects your RoR. Leverage can magnify gains when property values rise, and losses when markets fall. Understanding how debt structures influence returns is critical for accurate RoR analysis.
Unlevered vs. Levered Rate of Return
Unlevered RoR measures performance without considering debt. It reflects the property's true operating results based only on purchase price, rental income, and sale proceeds. Levered RoR, on the other hand, factors in loan payments, refinancing costs, and interest rates, showing the return on your actual cash invested.
For example, a $5 million property financed with 70% debt requires only $1.5 million in equity. If the property appreciates 10%, the equity value could jump much higher-because the gain is measured against a smaller cash outlay. But loan costs, vacancy risk, and refinancing risks must also be included in the analysis.
How Leverage Amplifies Risk and Reward
Using leverage can turn modest property appreciation into strong equity returns. However, it cuts both ways. A 10% decline in property value could wipe out 30% or more of your initial investment when high leverage is used.
To analyze properly, compare:
- Purpose of leverage ratio - total debt compared to property value
- Commercial property loan to value - loan amount as a percentage of purchase price
- Commercial property loans - terms like fixed vs floating rates, interest-only periods, and recourse requirements
How Taxes, Depreciation, and 1031 Exchanges Impact Rate of Return
Taxes can significantly change your real world RoR. Basic RoR formulas ignore taxes, but after tax results often tell a different story.
Depreciation's Role in Boosting After Tax RoR
Depreciation lets you offset rental income with non-cash expenses, reducing taxes and improving after tax RoR. Over time, this tax shelter effect compounds, increasing your net returns.
Using 1031 Exchanges to Defer Taxes
A 1031 exchange allows you to sell a property and reinvest without immediately paying capital gains taxes. Deferring taxes keeps more equity working for you, strengthening your RoR over time. By preserving more capital through deferral, a 1031 exchange effectively increases the base on which future returns are earned, boosting both cumulative and annualized RoR outcomes.
Frequently Asked Questions
How does leverage impact rate of return in commercial real estate?
Leverage increases both potential gains and losses in RoR. A 5% property value increase can translate to a 15% or higher equity return with 70% financing, but downside risks grow equally fast. To assess levered RoR properly, model loan costs, use a DSCR calculator to stress-test cash flows, and calculate break-even occupancy rates.
Why does IRR show a different result than simple rate of return?
Simple RoR measures total gain relative to initial cost, ignoring cash flow timing. IRR adjusts for when cash moves in and out, factoring the time value of money. In deals with uneven rents, renovations, or refinancing events, IRR typically gives a more accurate annualized return than simple RoR.
How should I benchmark my property's rate of return?
Match your RoR against a relevant market index, such as NCREIF or NAREIT, based on property type, class, and location. Always annualize returns and adjust for holding periods, asset risk, and market cycles to ensure standardized, apples-to-apples comparisons.
If you're ready to apply rate of return strategies to real opportunities, explore available commercial properties for sale.
Commercial Real Estate For Sale