Yield on Cost: Evaluating Returns and Risks in Commercial Property Investments

What is Yield on Cost?
Yield on Cost is a ratio that measures investment efficiency. It compares a property's stabilized net operating income to its total project cost.
Strategic Importance
This metric shows how much income a property generates relative to all money invested. It helps investors decide if the returns match the costs. It also allows investors to quickly compare different projects. This comparison helps highlight which opportunities offer better value for the money spent.
Components of Total Project Cost
Total project cost is the complete sum of money spent to acquire and develop a property, whether it's a multifamily property, office space, or an industrial property. It covers every expense incurred during the project.
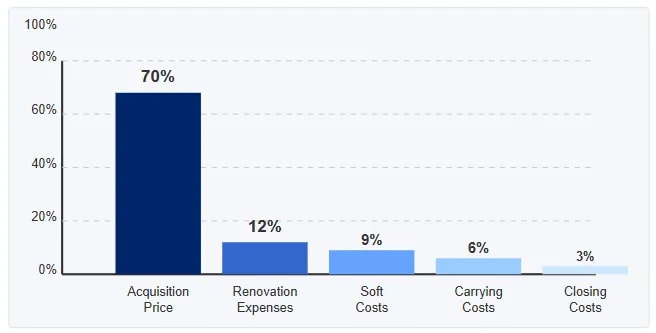
Acquisition: $28M | Renovation: $4.8M | Soft Costs: $3.6M | Carrying Costs: $2.4M | Closing: $1.2M
By adding all the following elements, you get the total project cost. This figure is essential when calculating yield on cost because it represents the full investment made.
- Acquisition Price: The cost to purchase the property.
- Closing Costs: Fees and expenses related to the property transaction.
- Renovation Expenses: Funds spent on improvements or repairs.
- Carrying Costs: Ongoing expenses like financing, insurance, and taxes during the project.
- Soft Costs: Indirect costs such as legal fees, permits, and project management.
What is Yield on Cost Used For?

Yield on cost is a versatile tool in commercial real estate investing. It not only measures potential returns but also helps investors gauge project risk. It enables quick comparisons between projects and highlights the most efficient investments. This metric also supports decision making when weighing different investment opportunities.
Investment Analysis
Yield on cost allows investors to compare projected income to the money invested. This analysis is crucial in evaluating if a project meets return expectations. It's a key metric in CRE investments. It helps to highlight projects that deliver strong income relative to cost. This metric also aids in identifying investments that may require further review to improve efficiency.
When to Use Yield on Cost
1. Evaluating Value Add Investments
When a property needs significant renovations or improvements, yield on cost helps assess if the increased income will justify the extra costs. It provides a quick check on whether the value add strategy makes sense. This method is key in identifying projects that can generate additional returns.
2. Comparing Development Projects
Yield on cost allows investors to compare the projected returns of multiple development projects. It enables an apples to apples analysis by considering the total investment required for each project. This comparison helps pinpoint the most cost effective opportunities.
3. Assessing Risk in Development
Since yield on cost includes all project expenses, it gives a clear view of the risks involved. Investors can determine if the expected return adequately compensates for those risks. This careful assessment is essential in high risk development ventures.
4. Calculating Development Spread
By comparing yield on cost with the market capitalization rate, investors calculate the development spread. This spread represents the extra return earned over market rates, helping to assess value creation and risk. It also informs decisions about exit cap rates.
Integrating yield on cost into your strategy means mastering related processes. A detailed commercial building valuation helps you compare project costs and returns accurately. Together, these steps complement yield on cost analysis and lead to more informed investment decisions.
Yield on Cost Formula
Yield on cost is calculated as the stabilized net operating income divided by the total project cost. This formula shows the percentage return based on the full investment made.
This means that every dollar spent on acquiring and developing the property is weighed against the income it is expected to generate once stabilized. It is a simple yet powerful way to measure investment efficiency.
For example, if an office building is expected to generate $2.4 million in stabilized NOI and costs $40 million, the yield on cost would be 6%. This calculation helps investors compare different projects and decide if an investment meets their return objectives.
What is a Good Yield on Cost?
A good yield on cost typically exceeds the prevailing market cap rate by at least 150 to 200 basis points, indicating that the project is generating sufficient returns relative to its cost. This benchmark shows that the development or value add strategy is effectively enhancing investment performance. Acceptable yields may vary by property type and market conditions, so it's important to compare against local benchmarks.
Take a look at current office buildings for sale to see how yield on cost can be applied in a real world setting.
Office Space For Sale
Yield on Cost vs. Cap Rate and Development Spread
Yield on cost and cap rate are key metrics used to evaluate property returns. Yield on cost is based on the total project cost, while cap rate relies on the property's market value. This distinction helps investors see the return from the actual money invested versus the current market performance.
Key Differences
Yield on cost measures return on every dollar spent on acquisition and development. In contrast, cap rate uses the property's market value to assess its performance. This difference is crucial because it highlights the impact of development and renovation expenses on overall returns.
Understanding Development Spread
Development spread is the difference between yield on cost and the cap rate. It shows the extra return earned by taking on development risk. A positive development spread indicates value creation, while a negative spread suggests that the project may not be financially sound.
These metrics work together to help investors compare projects and make informed decisions. They provide a clearer picture of whether a development project meets return expectations.
For further insights into market dynamics, explore types of commercial real estate and the sales comparison approach to property valuation.
Commercial Properties For Sale
How to Use Yield on Cost in Decision Making
Yield on cost plays a critical role in guiding investment decisions by comparing expected returns against project risks.
Development vs. Acquisition Decision
When the projected yield on cost for development exceeds the market cap rate by 150 to 200 basis points, development is a favorable option. If it does not, acquisition might be the better choice. For example, if Class A office properties trade at a 5.5% cap rate, only proceed with development if you can achieve a yield on cost of at least 7.0 to 7.5%.
Value Add Investment Threshold
For value add projects, compare the post renovation yield on cost to your required return threshold. If it exceeds the threshold by at least 100 basis points, the strategy is likely justified. This ensures that additional risk and execution complexity are properly compensated.
Exit Timing Guide
Monitor your current yield on cost against market cap rates for similar stabilized properties. If the yield on cost falls below these market rates, consider selling the asset. Conversely, if it stays 100 or more basis points above the current acquisition cap rate, holding the asset may maximize returns.
For instance, if you develop a property with a 7.5% yield on cost and similar properties now trade at 6%, the built-in equity appreciation suggests it may be an opportune time to sell and reinvest. This strategy can be further enhanced by using a 1031 exchange to defer capital gains taxes while seizing new opportunities.
Advanced Risk Analysis and Sensitivity Factors
This section dives deeper into assessing risk by examining how sensitive yield on cost is to changes in key inputs.
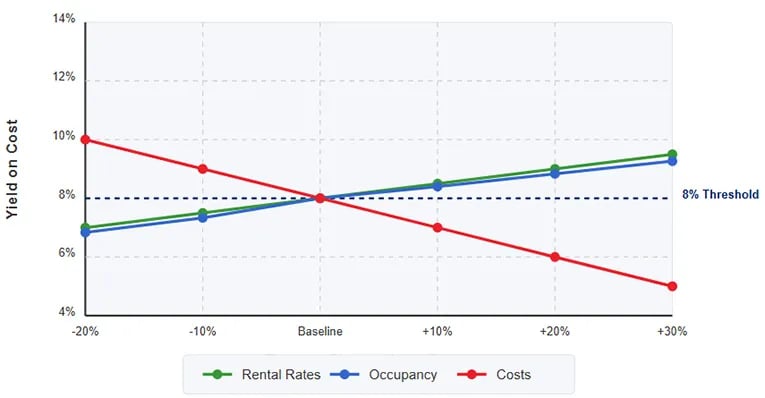
Mapping the Yield Impact Curve
Mapping the yield impact curve helps identify which variables most affect yield. Small changes in renovation costs or occupancy rates can lead to large differences in yield on cost. Understanding this curve pinpoints where cost control is critical.
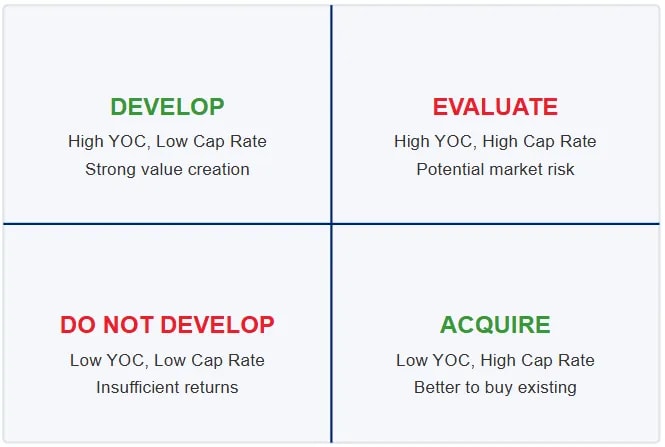
Building Decision Matrices
Decision matrices establish clear go or no go thresholds based on sensitivity outcomes. They allow you to see how yield changes under different scenarios and decide when an investment is worthwhile. This structured approach supports a disciplined decision making process. For example, an investor might set a threshold that requires a minimum yield on cost of 8% and then use a matrix to determine how variations in renovation costs affect this yield. Such matrices can be built in a simple spreadsheet, providing a visual and quantitative guide to inform critical investment decisions.
Sensitivity Analysis: Impact on Yield on Cost
Integrating Related Financial Metrics
Advanced risk analysis benefits from comparing yield on cost with other metrics. For example, consider the insights from debt yield and verify stability using a DSCR calculator. In some cases, you may need to extend and pretend in your planning to adjust for unexpected changes.
This advanced approach ensures you manage risks effectively while focusing on potential returns. It leads to more robust investment decisions under various market conditions.
What Metrics Should Be Used Alongside Yield on Cost?
Yield on cost is a powerful measure, but using it with other metrics creates a complete picture of a property's performance. Each metric complements yield on cost by addressing different aspects of an investment's risk and return profile.
Key Complementary Metrics
Occupancy Rate: This metric indicates the percentage of leased space and helps forecast income stability. A high occupancy rate supports a strong yield on cost by ensuring consistent revenue streams.
Cash Flow: Cash flow measures the money left after all expenses, showing how effectively a property generates profit. Solid cash flow reinforces yield on cost by confirming that operational income exceeds costs.
Net Operating Income (NOI): As the foundation of yield on cost calculations, NOI offers a clear view of a property's operational profitability before taxes and financing costs. It directly ties into yield on cost by forming its numerator.
Cash on Cash Return: This metric measures the annual return relative to the cash invested, providing insight into short term performance. When paired with yield on cost, it helps investors understand both immediate and long term returns.
Internal Rate of Return (IRR): IRR accounts for the time value of money and captures long term performance, especially in projects with extended development timelines. Investors use an IRR calculator to model various scenarios and compare development projects with different cash flow patterns. It works with yield on cost to reveal how quickly an investment might recoup its initial outlay.
Debt Yield: Debt yield evaluates the return a lender receives on a property's income without considering debt structure. This metric reinforces yield on cost by ensuring that the property's income supports the investment and its financing.
Debt Service Coverage Ratio (DSCR): DSCR measures the property's ability to cover its debt payments from its NOI. A healthy DSCR, alongside a strong yield on cost, indicates that the property is well-positioned to meet both operational and financing obligations.
Internal Rate of Return: Understanding both yield on cost and the internal rate of return gives a fuller view of a project's performance. Yield on cost shows how much income you get from every dollar invested. In contrast, the internal rate of return measures the annual return over the life of the project.
Together, these metrics work in harmony to validate the assumptions behind yield on cost. They help investors identify potential risks, ensure all cost elements are accounted for, and guide more informed investment decisions.
Important Things to Remember
Yield on cost is based on projected income and relies on careful estimates. Because these numbers are predictions, they depend on accurate assumptions about future performance.
It should not be used as the sole metric. Combining yield on cost with other measures gives you a full view of an investment's potential.
Remember to include every cost in your calculations, such as acquisition, renovations, and all other expenses. Missing any cost can lead to an inflated yield on cost figure.
This comprehensive approach reduces risk and improves the chances of successful investments.