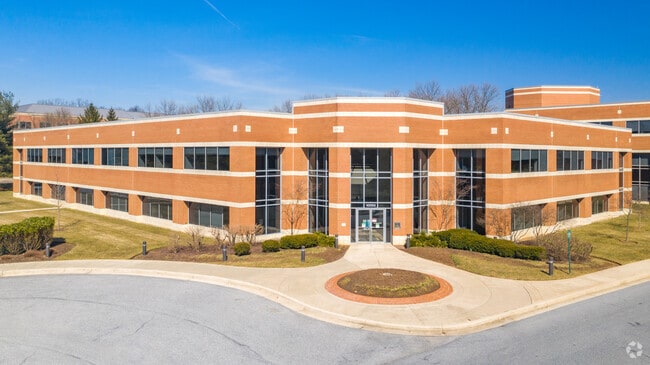
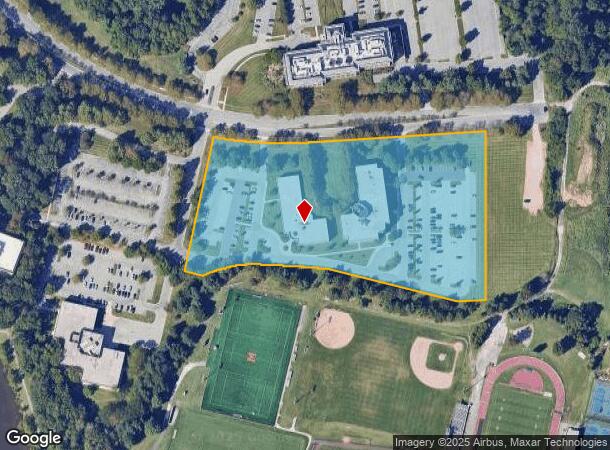
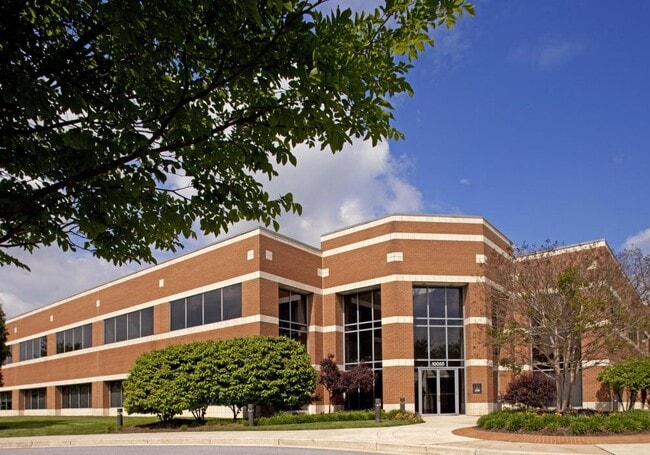
Property Record
10055 Red Run Blvd, Owings Mills, MD 21117
NEARBY LISTINGS FOR SALE OR LEASE
Property Detail
10055 Red Run Blvd
Baltimore-Columbia-Towson, MD
Owings Mills Corp Camp
02-2100001348
8.468 AC OWINGS MILLS CORP CAMP
Officebuilding
Baltimore
X
Maryland
24013C0350D
3
2024
8.47 AC
2025
Reisterstown Rd Corridor
402603
Baltimore
94,240 SF
DEMOGRAPHICS near 10055 Red Run Blvd
1 Mile
3 Mile
5 Mile
2024 Total Population
8,307
96,533
189,009
2029 Population
8,355
95,481
186,106
Pop Growth 2024-2029
+ 0.58%
(1.09%)
(1.54%)
Average Age
38
40
41
2024 Total Households
3,754
38,330
73,901
HH Growth 2024-2029
+ 0.45%
(1.14%)
(1.59%)
Median Household Inc
$92,823
$84,436
$83,434
Avg Household Size
2.20
2.40
2.50
2024 Avg HH Vehicles
1.00
2.00
2.00
Median Home Value
$266,068
$285,891
$305,290
Median Year Built
2001
1987
1979
Nearby Places
Map Layers
Map Styles
 Street
 Aerial
- Restaurants
- Banks
- Shops
- Fitness
- Groceries
PUBLIC TRANSPORTATION
TRANSIT/SUBWAY
Owings Mills (Metro Subway - Maryland Transit Administration Metro Subway (Baltimore Metro))
DRIVE
WALK
Distance
Owings Mills (Metro Subway - Maryland Transit Administration Metro Subway (Baltimore Metro))
15 min
16 min
0.9 mi
AIRPORT
Baltimore/Washington International Thurgood Marshall
DRIVE
WALK
Distance
Baltimore/Washington International Thurgood Marshall
33 min
20.8 mi
Freight Ports
Port of Baltimore
DRIVE
WALK
Distance
Port of Baltimore
34 min
21.3 mi
SALE & LEASE HISTORY
LISTING DATE
SALE/LEASE

Sep 24, 2016
For Lease
Apr 15, 2017
For Lease
Nearby Properties
Address
Land Use
TOTAL SIZE
Lot Size
Zoning
Address
Land Use
TOTAL SIZE
Lot Size
Zoning
408,321 SF
39.16 AC
BM
Address
Land Use
TOTAL SIZE
Lot Size
Zoning
630,367 SF
470.44 AC
DR1
Address
Land Use
TOTAL SIZE
Lot Size
Zoning
569,200 SF
8.82 AC
BM
Address
Land Use
TOTAL SIZE
Lot Size
Zoning
250,000 SF
1.61 AC
BMCT
Address
Land Use
TOTAL SIZE
Lot Size
Zoning
Address
Land Use
TOTAL SIZE
Lot Size
Zoning
452,042 SF
17.18 AC
RAE2
Address
Land Use
TOTAL SIZE
Lot Size
Zoning
709,328 SF
25.59 AC
OT
Address
Land Use
TOTAL SIZE
Lot Size
Zoning
12 AC
DR10
Address
Land Use
TOTAL SIZE
Lot Size
Zoning
23.07 AC
DR16
Address
Land Use
TOTAL SIZE
Lot Size
Zoning
4.31 AC
BM-CT
Address
Land Use
TOTAL SIZE
Lot Size
Zoning
300,838 SF
33.27 AC
DR105
Address
Land Use
TOTAL SIZE
Lot Size
Zoning
336,539 SF
12.38 AC
DR16
Address
Land Use
TOTAL SIZE
Lot Size
Zoning
Address
Land Use
TOTAL SIZE
Lot Size
Zoning
325,203 SF
6.24 AC
DR5.5
Address
Land Use
TOTAL SIZE
Lot Size
Zoning
159.90 AC
Address
Land Use
TOTAL SIZE
Lot Size
Zoning
464,593 SF
6.38 AC
BM
Address
Land Use
TOTAL SIZE
Lot Size
Zoning
333,600 SF
8.39 AC
ML
Address
Land Use
TOTAL SIZE
Lot Size
Zoning
16.48 AC
DR16
Address
Land Use
TOTAL SIZE
Lot Size
Zoning
281,620 SF
8.58 AC
Address
Land Use
TOTAL SIZE
Lot Size
Zoning
756,000 SF
2.63 AC
Address
Land Use
TOTAL SIZE
Lot Size
Zoning
224,204 SF
7.64 AC
RAE2
Address
Land Use
TOTAL SIZE
Lot Size
Zoning
589,225 SF
1.96 AC
Address
Land Use
TOTAL SIZE
Lot Size
Zoning
99,153 SF
9.41 AC
OR2
Address
Land Use
TOTAL SIZE
Lot Size
Zoning
13.82 AC
DR16
Address
Land Use
TOTAL SIZE
Lot Size
Zoning
146,149 SF
1.08 AC
BM-CT
Address
Land Use
TOTAL SIZE
Lot Size
Zoning
285,044 SF
15.16 AC
MLIM
Address
Land Use
TOTAL SIZE
Lot Size
Zoning
Address
Land Use
TOTAL SIZE
Lot Size
Zoning
14.36 AC
DR16
Address
Land Use
TOTAL SIZE
Lot Size
Zoning
7.05 AC
BM
Address
Land Use
TOTAL SIZE
Lot Size
Zoning
11.96 AC
DR16
The World's #1 Commercial Real Estate Marketplace
Connect with us
© 2025 CoStar Group
The information above has been obtained from sources believed reliable. While we do not doubt its accuracy we have not verified it and make no guarantee, warranty or representation about it. It is your responsibility to independently confirm its accuracy and completeness. Any projections, opinions, assumptions, or estimates used are for example only and do not represent the current or future performance of the property. The value of this transaction to you depends on tax and other factors which should be evaluated by your tax, financial, and legal advisors. You and your advisors should conduct a careful, independent investigation of the property to determine to your satisfaction the suitability of the property for your needs.