Property Record
10238 Cherry Ave, Fontana, CA 92335


NEARBY LISTINGS FOR SALE OR LEASE
Property Detail
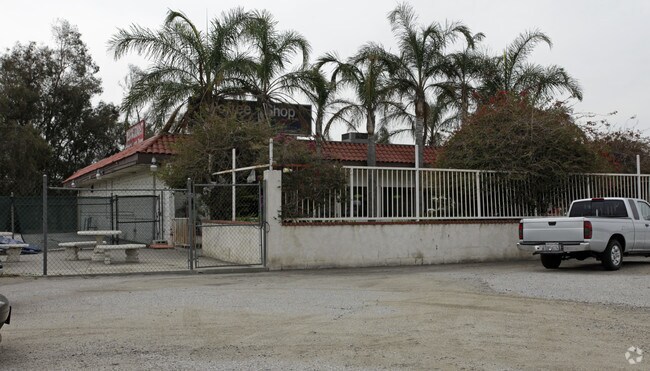
10238 Cherry Ave
Riverside-San Bernardino-Ontario, CA
Semi-Tropic Land
0234-211-22
S T L AND W CO S B L E 1/2 LOT 1028 EX THAT PTN CONVEYED FOR HGWY IN DEED RECORDED 10/28/57 BK 4355 PG 275 OFFICIAL RECORDS AND EX FOLL DESC BEG ON SLY LI SD LOT AT THE WLY TERMINUS OF THE COURSE DESC AS COURSE A IN DEED RECORDED 10/28/57 B
Vacantlandnec
San Bernardino
X
California
06071C8653J
1028
2024
7.58 AC
2025
Airport Area
002204
Inland Empire (California)
3,000 SF
DEMOGRAPHICS near 10238 Cherry Ave
1 Mile
3 Mile
5 Mile
2024 Total Population
3,332
86,311
260,774
2029 Population
3,331
87,382
265,626
Pop Growth 2024-2029
(0.03%)
+ 1.24%
+ 1.86%
Average Age
36
35
35
2024 Total Households
828
21,095
70,271
HH Growth 2024-2029
(0.12%)
+ 1.27%
+ 1.91%
Median Household Inc
$70,945
$81,175
$85,459
Avg Household Size
3.90
3.90
3.60
2024 Avg HH Vehicles
3.00
3.00
2.00
Median Home Value
$354,662
$418,675
$460,612
Median Year Built
1962
1984
1987
Nearby Places
Map Layers
Map Styles
 Street
 Aerial
- Restaurants
- Banks
- Shops
- Fitness
- Groceries
PUBLIC TRANSPORTATION
COMMUTER RAIL
Rancho Cucamonga (San Bernardino Line - Southern California Regional Rail Authority (Metrolink))
DRIVE
WALK
Distance
Rancho Cucamonga (San Bernardino Line - Southern California Regional Rail Authority (Metrolink))
9 min
5.9 mi
East Ontario (Riverside Line - Southern California Regional Rail Authority (Metrolink))
DRIVE
WALK
Distance
East Ontario (Riverside Line - Southern California Regional Rail Authority (Metrolink))
11 min
7.4 mi
AIRPORT
Ontario International
DRIVE
WALK
Distance
Ontario International
13 min
8.1 mi
John Wayne/Orange County
DRIVE
WALK
Distance
John Wayne/Orange County
55 min
45.5 mi
Freight Ports
Port of Long Beach
DRIVE
WALK
Distance
Port of Long Beach
73 min
59.6 mi
Nearby Properties
Address
Land Use
TOTAL SIZE
Lot Size
Zoning
Address
Land Use
TOTAL SIZE
Lot Size
Zoning
1,422,524 SF
44.96 AC
Address
Land Use
TOTAL SIZE
Lot Size
Zoning
362.37 AC
Address
Land Use
TOTAL SIZE
Lot Size
Zoning
425.43 AC
SDCOM
Address
Land Use
TOTAL SIZE
Lot Size
Zoning
690,967 SF
33.39 AC
Address
Land Use
TOTAL SIZE
Lot Size
Zoning
1,613,290 SF
59.42 AC
Address
Land Use
TOTAL SIZE
Lot Size
Zoning
817,750 SF
35.82 AC
Address
Land Use
TOTAL SIZE
Lot Size
Zoning
912 SF
370.60 AC
IR
Address
Land Use
TOTAL SIZE
Lot Size
Zoning
752,497 SF
24.89 AC
Address
Land Use
TOTAL SIZE
Lot Size
Zoning
1,385,866 SF
69.84 AC
Address
Land Use
TOTAL SIZE
Lot Size
Zoning
1,286,569 SF
53.96 AC
Address
Land Use
TOTAL SIZE
Lot Size
Zoning
459,431 SF
23.10 AC
Address
Land Use
TOTAL SIZE
Lot Size
Zoning
34.80 AC
Address
Land Use
TOTAL SIZE
Lot Size
Zoning
444,668 SF
20.74 AC
Address
Land Use
TOTAL SIZE
Lot Size
Zoning
500,403 SF
24.69 AC
Address
Land Use
TOTAL SIZE
Lot Size
Zoning
319,375 SF
14.66 AC
Address
Land Use
TOTAL SIZE
Lot Size
Zoning
1,003,567 SF
42.97 AC
Address
Land Use
TOTAL SIZE
Lot Size
Zoning
210,615 SF
9.42 AC
MM
Address
Land Use
TOTAL SIZE
Lot Size
Zoning
104,537 SF
30.72 AC
Address
Land Use
TOTAL SIZE
Lot Size
Zoning
55.52 AC
Address
Land Use
TOTAL SIZE
Lot Size
Zoning
300,205 SF
12.63 AC
Address
Land Use
TOTAL SIZE
Lot Size
Zoning
76.50 AC
Address
Land Use
TOTAL SIZE
Lot Size
Zoning
19,440 SF
20.95 AC
M2
Address
Land Use
TOTAL SIZE
Lot Size
Zoning
849,900 SF
39.25 AC
KCSP
Address
Land Use
TOTAL SIZE
Lot Size
Zoning
282,224 SF
11.91 AC
Address
Land Use
TOTAL SIZE
Lot Size
Zoning
291,742 SF
12.10 AC
Address
Land Use
TOTAL SIZE
Lot Size
Zoning
263,188 SF
12.63 AC
Address
Land Use
TOTAL SIZE
Lot Size
Zoning
970,747 SF
19.56 AC
Address
Land Use
TOTAL SIZE
Lot Size
Zoning
194,595 SF
8.61 AC
Address
Land Use
TOTAL SIZE
Lot Size
Zoning
214,495 SF
9.89 AC
SDCOM
Address
Land Use
TOTAL SIZE
Lot Size
Zoning
1,034,356 SF
47.48 AC
The World's #1 Commercial Real Estate Marketplace
Connect with us
© 2025 CoStar Group
The information above has been obtained from sources believed reliable. While we do not doubt its accuracy we have not verified it and make no guarantee, warranty or representation about it. It is your responsibility to independently confirm its accuracy and completeness. Any projections, opinions, assumptions, or estimates used are for example only and do not represent the current or future performance of the property. The value of this transaction to you depends on tax and other factors which should be evaluated by your tax, financial, and legal advisors. You and your advisors should conduct a careful, independent investigation of the property to determine to your satisfaction the suitability of the property for your needs.