Property Record
106 High St, Danvers, MA 01923


Property Detail
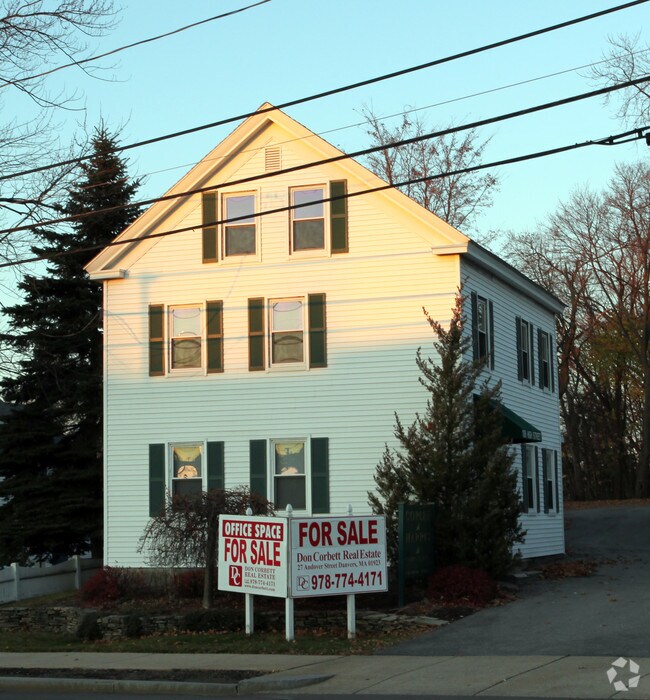
106 High St
DANV-000052-000000-000094
Essex
Officebuilding
Massachusetts
I1
94
B and X Area of moderate flood hazard, usually the area between the limits of the 100-year and 500-year floods.
0.45 AC
2025
Danvers/Beverly
2025
Boston
211201
Boston-Cambridge-Newton, MA-NH
2,052 SF
NEARBY LISTINGS FOR SALE OR LEASE
DEMOGRAPHICS near 106 High St
1 mile
3 mile
5 mile
2025 Total Population
10,994
99,401
195,068
2030 Population
11,300
101,576
199,670
Pop Growth 2025-2030
+ 2.78%
+ 2.19%
+ 2.36%
Average Age
43
43
43
2025 Total Households
4,521
42,523
78,736
HH Growth 2025-2030
+ 2.72%
+ 2.20%
+ 2.31%
Median Household Inc
$109,357
$93,494
$100,931
Avg Household Size
2.30
2.30
2.30
2025 Avg HH Vehicles
2.00
2.00
2.00
Median Home Value
$665,894
$643,214
$675,020
Median Year Built
1956
1960
1961
Nearby Places
Map Layers
Map Styles
 Street
 Aerial
Transit
 Traffic
 Biking
Places
Listings with unknown addresses are not visible on the map
- Restaurants
- Banks
- Shops
- Fitness
- Groceries
PUBLIC TRANSPORTATION
COMMUTER RAIL
North Beverly (Newburyport/Rockport Line - Massachusetts Bay Transportation Authority Commuter Rail (Purple Line))
Drive
Walk
Distance
North Beverly (Newburyport/Rockport Line - Massachusetts Bay Transportation Authority Commuter Rail (Purple Line))
6 min
3.4 mi
Salem (Newburyport/Rockport Line - Massachusetts Bay Transportation Authority Commuter Rail (Purple Line))
Drive
Walk
Distance
Salem (Newburyport/Rockport Line - Massachusetts Bay Transportation Authority Commuter Rail (Purple Line))
9 min
3.6 mi
AIRPORT
General Edward Lawrence Logan International
Drive
Walk
Distance
General Edward Lawrence Logan International
32 min
19.2 mi
Manchester Boston Regional
Drive
Walk
Distance
Manchester Boston Regional
72 min
49.6 mi
Nearby Properties
Address
Land Use
TOTAL SIZE
Lot Size
Zoning
Address
Land Use
TOTAL SIZE
Lot Size
Zoning
747,237 SF
36.70 AC
HW
Address
Land Use
TOTAL SIZE
Lot Size
Zoning
48.89 AC
IG
Address
Land Use
TOTAL SIZE
Lot Size
Zoning
10,368 SF
33.83 AC
R3
Address
Land Use
TOTAL SIZE
Lot Size
Zoning
252,965 SF
56.44 AC
R3
Address
Land Use
TOTAL SIZE
Lot Size
Zoning
14.69 AC
I
Address
Land Use
TOTAL SIZE
Lot Size
Zoning
17 AC
R4
Address
Land Use
TOTAL SIZE
Lot Size
Zoning
49 AC
I2
Address
Land Use
TOTAL SIZE
Lot Size
Zoning
267,051 SF
41.08 AC
R10
Address
Land Use
TOTAL SIZE
Lot Size
Zoning
17.60 AC
R1A
Address
Land Use
TOTAL SIZE
Lot Size
Zoning
13.04 AC
HC
Address
Land Use
TOTAL SIZE
Lot Size
Zoning
9.71 AC
BR
Address
Land Use
TOTAL SIZE
Lot Size
Zoning
228,295 SF
12.50 AC
RMD
Address
Land Use
TOTAL SIZE
Lot Size
Zoning
231,509 SF
17.71 AC
R10
Address
Land Use
TOTAL SIZE
Lot Size
Zoning
172.50 AC
R3
Address
Land Use
TOTAL SIZE
Lot Size
Zoning
49.85 AC
R1B
Address
Land Use
TOTAL SIZE
Lot Size
Zoning
182,122 SF
23.33 AC
R10
Address
Land Use
TOTAL SIZE
Lot Size
Zoning
65.79 AC
I1
Address
Land Use
TOTAL SIZE
Lot Size
Zoning
206.65 AC
R1B
Address
Land Use
TOTAL SIZE
Lot Size
Zoning
207,237 SF
16.73 AC
RMD
Address
Land Use
TOTAL SIZE
Lot Size
Zoning
11.08 AC
R4
Address
Land Use
TOTAL SIZE
Lot Size
Zoning
59.99 AC
IP
Address
Land Use
TOTAL SIZE
Lot Size
Zoning
195,527 SF
16.60 AC
CG
Address
Land Use
TOTAL SIZE
Lot Size
Zoning
25.72 AC
IP
Address
Land Use
TOTAL SIZE
Lot Size
Zoning
170,652 SF
23.73 AC
HD
Address
Land Use
TOTAL SIZE
Lot Size
Zoning
408,207 SF
37.12 AC
C3
Address
Land Use
TOTAL SIZE
Lot Size
Zoning
4.14 AC
NRCC
Address
Land Use
TOTAL SIZE
Lot Size
Zoning
358,662 SF
36.98 AC
IR
Address
Land Use
TOTAL SIZE
Lot Size
Zoning
28.30 AC
IP
Address
Land Use
TOTAL SIZE
Lot Size
Zoning
162,182 SF
9.53 AC
IR
Address
Land Use
TOTAL SIZE
Lot Size
Zoning
93,789 SF
8.22 AC
HW
The World's #1 Commercial Real Estate Marketplace
Connect with us
© 2026 CoStar Group
The information above has been obtained from sources believed reliable. While we do not doubt its accuracy we have not verified it and make no guarantee, warranty or representation about it. It is your responsibility to independently confirm its accuracy and completeness. Any projections, opinions, assumptions, or estimates used are for example only and do not represent the current or future performance of the property. The value of this transaction to you depends on tax and other factors which should be evaluated by your tax, financial, and legal advisors. You and your advisors should conduct a careful, independent investigation of the property to determine to your satisfaction the suitability of the property for your needs.