Property Record
1151 Cadillac Ct, Milpitas, CA 95035


Property Detail
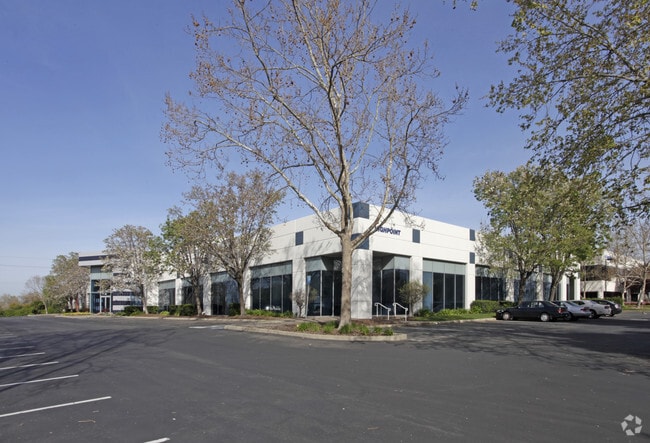
1151 Cadillac Ct
022-38-010
LOT E RECORDER'S BOOK 520 PAGE 37
Industrialgeneral
SANTA CLARA
HS
California
AH Areas with a 1% annual chance of shallow flooding, usually in the form of a pond, withan average depth ranging from 1 to 3 feet. These areas have a 26% chance of flooding over the life of a 30-year mortgage.
3 AC
2024
Milpitas
2025
South Bay/San Jose
504509
San Jose-Sunnyvale-Santa Clara, CA
44,629 SF
NEARBY LISTINGS FOR SALE OR LEASE
DEMOGRAPHICS near 1151 Cadillac Ct
1 mile
3 mile
5 mile
2025 Total Population
15,368
104,504
223,721
2030 Population
15,678
107,174
228,900
Pop Growth 2025-2030
+ 2.02%
+ 2.55%
+ 2.31%
Average Age
40
38
39
2025 Total Households
4,689
34,639
74,381
HH Growth 2025-2030
+ 2.07%
+ 2.76%
+ 2.41%
Median Household Inc
$159,151
$188,833
$187,748
Avg Household Size
3.20
2.90
2.90
2025 Avg HH Vehicles
2.00
2.00
2.00
Median Home Value
$1,086,165
$1,092,924
$1,093,142
Median Year Built
1982
1995
1991
Nearby Places
Map Layers
Map Styles
 Street
 Aerial
Layers
 Traffic
 Biking
Places
Listings with unknown addresses are not visible on the map
- Restaurants
- Banks
- Shops
- Fitness
- Groceries
PUBLIC TRANSPORTATION
COMMUTER RAIL
Great America-Santa Clara (ACE Train - Capitol Corridor Joint Powers Authority, Capitol Corridor - Capitol Corridor Joint Powers Authority)
Drive
Walk
Distance
Great America-Santa Clara (ACE Train - Capitol Corridor Joint Powers Authority, Capitol Corridor - Capitol Corridor Joint Powers Authority)
12 min
7.6 mi
AIRPORT
Norman Y Mineta San Jose International
Drive
Walk
Distance
Norman Y Mineta San Jose International
15 min
10.1 mi
Metro Oakland International
Drive
Walk
Distance
Metro Oakland International
36 min
27.9 mi
San Francisco International
Drive
Walk
Distance
San Francisco International
47 min
36.1 mi
Freight Ports
Port of Redwood City
Drive
Walk
Distance
Port of Redwood City
32 min
22.9 mi
SALE & LEASE HISTORY
LISTING DATE
SALE/LEASE

Feb 10, 2017
For Lease
Dec 14, 2017
For Lease
Nearby Properties
Address
Land Use
TOTAL SIZE
Lot Size
Zoning
Address
Land Use
TOTAL SIZE
Lot Size
Zoning
7.49 AC
M2
Address
Land Use
TOTAL SIZE
Lot Size
Zoning
194,597 SF
20.10 AC
I
Address
Land Use
TOTAL SIZE
Lot Size
Zoning
636,145 SF
9.44 AC
IP
Address
Land Use
TOTAL SIZE
Lot Size
Zoning
663,216 SF
30.01 AC
Address
Land Use
TOTAL SIZE
Lot Size
Zoning
1,282,514 SF
99.02 AC
C2-S
Address
Land Use
TOTAL SIZE
Lot Size
Zoning
423,160 SF
6.24 AC
A(PD)
Address
Land Use
TOTAL SIZE
Lot Size
Zoning
556,649 SF
8.09 AC
IP
Address
Land Use
TOTAL SIZE
Lot Size
Zoning
7.08 AC
IP
Address
Land Use
TOTAL SIZE
Lot Size
Zoning
227,939 SF
2.72 AC
IP
Address
Land Use
TOTAL SIZE
Lot Size
Zoning
227,939 SF
2.17 AC
IP
Address
Land Use
TOTAL SIZE
Lot Size
Zoning
83,000 SF
16.70 AC
A(PD)
Address
Land Use
TOTAL SIZE
Lot Size
Zoning
503,840 SF
5.02 AC
MXD2
Address
Land Use
TOTAL SIZE
Lot Size
Zoning
350,507 SF
6.17 AC
APD
Address
Land Use
TOTAL SIZE
Lot Size
Zoning
328,189 SF
4.01 AC
R3
Address
Land Use
TOTAL SIZE
Lot Size
Zoning
3.72 AC
M2S
Address
Land Use
TOTAL SIZE
Lot Size
Zoning
5.21 AC
APD
Address
Land Use
TOTAL SIZE
Lot Size
Zoning
1,659,060 SF
6.42 AC
APD
Address
Land Use
TOTAL SIZE
Lot Size
Zoning
310,021 SF
5.45 AC
APD
Address
Land Use
TOTAL SIZE
Lot Size
Zoning
7.61 AC
A(PD)
Address
Land Use
TOTAL SIZE
Lot Size
Zoning
324,610 SF
3.27 AC
APD
Address
Land Use
TOTAL SIZE
Lot Size
Zoning
642,249 SF
6.89 AC
A(PD)
Address
Land Use
TOTAL SIZE
Lot Size
Zoning
270,200 SF
17.48 AC
IP
Address
Land Use
TOTAL SIZE
Lot Size
Zoning
339,693 SF
5.39 AC
APD
Address
Land Use
TOTAL SIZE
Lot Size
Zoning
362,780 SF
7.58 AC
APD
Address
Land Use
TOTAL SIZE
Lot Size
Zoning
316,904 SF
5.08 AC
APD
Address
Land Use
TOTAL SIZE
Lot Size
Zoning
4.56 AC
M2
Address
Land Use
TOTAL SIZE
Lot Size
Zoning
366,149 SF
2.98 AC
R3
Address
Land Use
TOTAL SIZE
Lot Size
Zoning
538,119 SF
7.04 AC
A(PD)
Address
Land Use
TOTAL SIZE
Lot Size
Zoning
179,843 SF
13.81 AC
IP
Address
Land Use
TOTAL SIZE
Lot Size
Zoning
162,240 SF
23.95 AC
A(PD)
The World's #1 Commercial Real Estate Marketplace
Connect with us
© 2026 CoStar Group
The information above has been obtained from sources believed reliable. While we do not doubt its accuracy we have not verified it and make no guarantee, warranty or representation about it. It is your responsibility to independently confirm its accuracy and completeness. Any projections, opinions, assumptions, or estimates used are for example only and do not represent the current or future performance of the property. The value of this transaction to you depends on tax and other factors which should be evaluated by your tax, financial, and legal advisors. You and your advisors should conduct a careful, independent investigation of the property to determine to your satisfaction the suitability of the property for your needs.