Property Record
128 S 1000 E, Salt Lake City, UT 84102


NEARBY LISTINGS FOR SALE OR LEASE
Property Detail
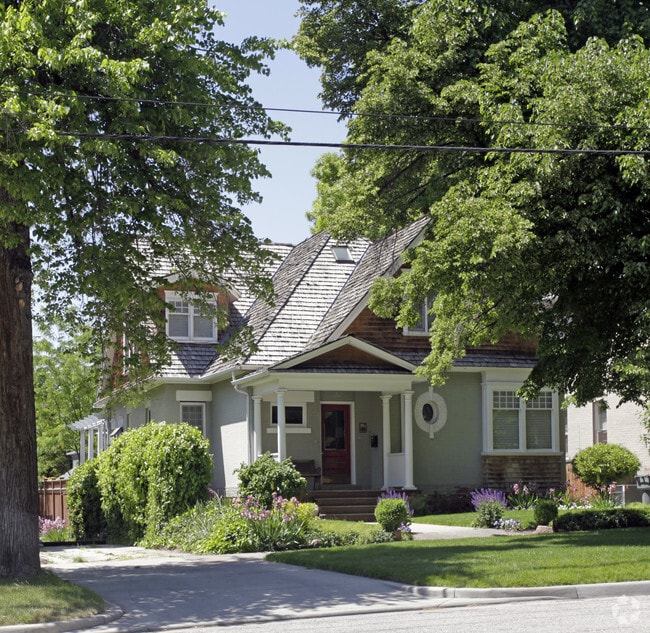
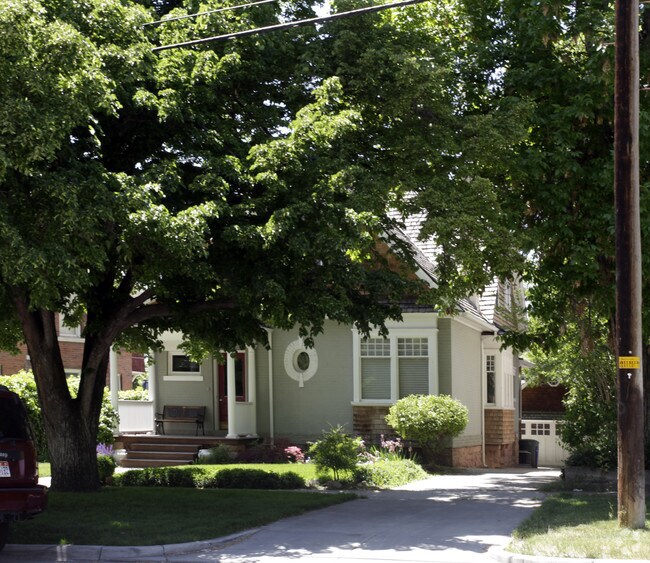
128 S 1000 E
Salt Lake City, UT
Mountain View Estates 13
16-05-135-017-0000
BEG AT SE COR LOT 6, BLK 56, PLAT B, SLC SUR; N 2.5 FT; W 135 FT; S 50 FT; E 135 FT; N 47.5 FT TO BEG. 4659-1153 5489-1038 5831-1458, 1460, 1461 5831-1462 5865-0435 5951-0785 6528-0179 6540-1661 6634-2803 08496-5287 10576-7493 10864-6069
Apartment
Salt Lake
X
Utah
49029C0475C
6
2024
0.15 AC
2025
East Central
101700
Salt Lake City
6,336 SF
DEMOGRAPHICS near 128 S 1000 E
1 Mile
3 Mile
5 Mile
2024 Total Population
26,336
124,662
237,660
2029 Population
26,756
127,334
241,675
Pop Growth 2024-2029
+ 1.59%
+ 2.14%
+ 1.69%
Average Age
36
37
37
2024 Total Households
14,115
59,486
101,589
HH Growth 2024-2029
+ 1.79%
+ 2.62%
+ 2.05%
Median Household Inc
$53,259
$62,830
$66,008
Avg Household Size
1.80
1.90
2.20
2024 Avg HH Vehicles
1.00
1.00
2.00
Median Home Value
$617,687
$593,043
$490,317
Median Year Built
1959
1965
1967
Nearby Places
Map Layers
Map Styles
 Street
 Aerial
- Restaurants
- Banks
- Shops
- Fitness
- Groceries
PUBLIC TRANSPORTATION
TRANSIT/SUBWAY
900 East (TRAX Murray/Midvale/University Line - Utah Transit Authority (UTA), TRAX University Line - Utah Transit Authority (UTA))
DRIVE
WALK
Distance
900 East (TRAX Murray/Midvale/University Line - Utah Transit Authority (UTA), TRAX University Line - Utah Transit Authority (UTA))
2 min
11 min
0.6 mi
Trolley Square (TRAX Murray/Midvale/University Line - Utah Transit Authority (UTA), TRAX University Line - Utah Transit Authority (UTA))
DRIVE
WALK
Distance
Trolley Square (TRAX Murray/Midvale/University Line - Utah Transit Authority (UTA), TRAX University Line - Utah Transit Authority (UTA))
2 min
17 min
0.9 mi
Stadium (TRAX Murray/Midvale/University Line - Utah Transit Authority (UTA), TRAX University Line - Utah Transit Authority (UTA))
DRIVE
WALK
Distance
Stadium (TRAX Murray/Midvale/University Line - Utah Transit Authority (UTA), TRAX University Line - Utah Transit Authority (UTA))
3 min
19 min
1.0 mi
COMMUTER RAIL
North Temple Station (FrontRunner - Utah Transit Authority (UTA))
DRIVE
WALK
Distance
North Temple Station (FrontRunner - Utah Transit Authority (UTA))
8 min
2.6 mi
Warm Springs Relief Point (FrontRunner - Utah Transit Authority (UTA))
DRIVE
WALK
Distance
Warm Springs Relief Point (FrontRunner - Utah Transit Authority (UTA))
11 min
4.0 mi
AIRPORT
Salt Lake City International
DRIVE
WALK
Distance
Salt Lake City International
16 min
8.7 mi
Freight Ports
Port of Stockton
DRIVE
WALK
Distance
Port of Stockton
716 min
699.0 mi
Nearby Properties
Address
Land Use
TOTAL SIZE
Lot Size
Zoning
Address
Land Use
TOTAL SIZE
Lot Size
Zoning
2,287,331 SF
137 AC
I
Address
Land Use
TOTAL SIZE
Lot Size
Zoning
1,260,285 SF
59.07 AC
I
Address
Land Use
TOTAL SIZE
Lot Size
Zoning
591,924 SF
80.77 AC
I
Address
Land Use
TOTAL SIZE
Lot Size
Zoning
298,342 SF
13.71 AC
I
Address
Land Use
TOTAL SIZE
Lot Size
Zoning
1,262,865 SF
44.15 AC
I
Address
Land Use
TOTAL SIZE
Lot Size
Zoning
1,115,174 SF
9.72 AC
D-4
Address
Land Use
TOTAL SIZE
Lot Size
Zoning
530,605 SF
127 AC
RP
Address
Land Use
TOTAL SIZE
Lot Size
Zoning
365,253 SF
33.64 AC
I
Address
Land Use
TOTAL SIZE
Lot Size
Zoning
352,836 SF
20.05 AC
PL
Address
Land Use
TOTAL SIZE
Lot Size
Zoning
350,000 SF
10 AC
U1
Address
Land Use
TOTAL SIZE
Lot Size
Zoning
295,047 SF
113.27 AC
RP
Address
Land Use
TOTAL SIZE
Lot Size
Zoning
56,741 SF
1.70 AC
D-1
Address
Land Use
TOTAL SIZE
Lot Size
Zoning
87,933 SF
4.90 AC
D-1
Address
Land Use
TOTAL SIZE
Lot Size
Zoning
185,202 SF
51.07 AC
J
Address
Land Use
TOTAL SIZE
Lot Size
Zoning
2,566,335 SF
10.01 AC
D-1
Address
Land Use
TOTAL SIZE
Lot Size
Zoning
205,570 SF
5.63 AC
UI
Address
Land Use
TOTAL SIZE
Lot Size
Zoning
1,849,748 SF
6.88 AC
D-1
Address
Land Use
TOTAL SIZE
Lot Size
Zoning
1,330,058 SF
5.02 AC
D2
Address
Land Use
TOTAL SIZE
Lot Size
Zoning
836,183 SF
5.89 AC
TSA-UC
Address
Land Use
TOTAL SIZE
Lot Size
Zoning
298,628 SF
27.30 AC
I
Address
Land Use
TOTAL SIZE
Lot Size
Zoning
807,940 SF
0.69 AC
D1
Address
Land Use
TOTAL SIZE
Lot Size
Zoning
299,535 SF
38 AC
I
Address
Land Use
TOTAL SIZE
Lot Size
Zoning
254,939 SF
34.68 AC
I
Address
Land Use
TOTAL SIZE
Lot Size
Zoning
712,539 SF
0.01 AC
D1
Address
Land Use
TOTAL SIZE
Lot Size
Zoning
1,256,042 SF
3.50 AC
D-1
Address
Land Use
TOTAL SIZE
Lot Size
Zoning
82,851 SF
9.76 AC
PL2
Address
Land Use
TOTAL SIZE
Lot Size
Zoning
440,898 SF
0.01 AC
RP
Address
Land Use
TOTAL SIZE
Lot Size
Zoning
588,291 SF
1.28 AC
D-1
Address
Land Use
TOTAL SIZE
Lot Size
Zoning
434,481 SF
10 AC
D-1
Address
Land Use
TOTAL SIZE
Lot Size
Zoning
497,018 SF
13.11 AC
I
The World's #1 Commercial Real Estate Marketplace
Connect with us
© 2026 CoStar Group
The information above has been obtained from sources believed reliable. While we do not doubt its accuracy we have not verified it and make no guarantee, warranty or representation about it. It is your responsibility to independently confirm its accuracy and completeness. Any projections, opinions, assumptions, or estimates used are for example only and do not represent the current or future performance of the property. The value of this transaction to you depends on tax and other factors which should be evaluated by your tax, financial, and legal advisors. You and your advisors should conduct a careful, independent investigation of the property to determine to your satisfaction the suitability of the property for your needs.