Property Record
130 Sandy Bottom Rd, Coventry, RI 02816
Property Detail
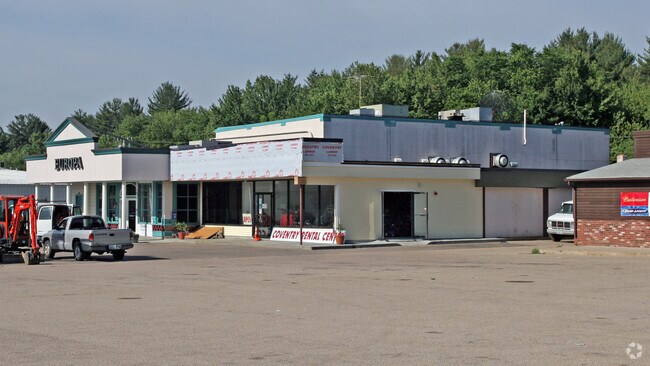
130 Sandy Bottom Rd
COVE-000038-000000-000129
KENT
Commercialbuilding
Rhode Island
2000
40
B and X Area of moderate flood hazard, usually the area between the limits of the 100-year and 500-year floods.
0.24 AC
2025
Coventry/West Greenwich
2025
Providence
020602
Providence-Warwick, RI-MA
1,200 SF
NEARBY LISTINGS FOR SALE OR LEASE
DEMOGRAPHICS near 130 Sandy Bottom Rd
1 mile
3 mile
5 mile
2025 Total Population
6,629
54,663
87,475
2030 Population
6,700
55,340
88,817
Pop Growth 2025-2030
+ 1.07%
+ 1.24%
+ 1.53%
Average Age
43
43
43
2025 Total Households
2,873
22,963
36,605
HH Growth 2025-2030
+ 1.11%
+ 1.28%
+ 1.53%
Median Household Inc
$81,629
$89,014
$93,944
Avg Household Size
2.30
2.30
2.30
2025 Avg HH Vehicles
2.00
2.00
2.00
Median Home Value
$285,202
$335,919
$371,112
Median Year Built
1964
1967
1971
Nearby Places
Map Layers
Map Styles
 Street
 Aerial
Transit
 Traffic
 Biking
Places
Listings with unknown addresses are not visible on the map
- Restaurants
- Banks
- Shops
- Fitness
- Groceries
PUBLIC TRANSPORTATION
COMMUTER RAIL
Tf Green Airport (Providence/Stoughton Line - MBTA)
Drive
Walk
Distance
Tf Green Airport (Providence/Stoughton Line - MBTA)
14 min
8.2 mi
AIRPORT
Rhode Island Tf Green International
Drive
Walk
Distance
Rhode Island Tf Green International
19 min
10.5 mi
Freight Ports
Port of Davisville, RI
Drive
Walk
Distance
Port of Davisville, RI
25 min
13.4 mi
Nearby Properties
Address
Land Use
TOTAL SIZE
Lot Size
Zoning
Address
Land Use
TOTAL SIZE
Lot Size
Zoning
71.87 AC
INDA
Address
Land Use
TOTAL SIZE
Lot Size
Zoning
31,158 SF
20.36 AC
SMD
Address
Land Use
TOTAL SIZE
Lot Size
Zoning
212,745 SF
19 AC
9239
Address
Land Use
TOTAL SIZE
Lot Size
Zoning
541,370 SF
34.08 AC
CI
Address
Land Use
TOTAL SIZE
Lot Size
Zoning
283,451 SF
51 AC
R-20
Address
Land Use
TOTAL SIZE
Lot Size
Zoning
240,425 SF
104.76 AC
R-10
Address
Land Use
TOTAL SIZE
Lot Size
Zoning
25,392 SF
26 AC
2000
Address
Land Use
TOTAL SIZE
Lot Size
Zoning
430,585 SF
33.42 AC
INDA
Address
Land Use
TOTAL SIZE
Lot Size
Zoning
169,035 SF
4 AC
6000
Address
Land Use
TOTAL SIZE
Lot Size
Zoning
170,322 SF
10.82 AC
CZD
Address
Land Use
TOTAL SIZE
Lot Size
Zoning
103,712 SF
12.20 AC
5314
Address
Land Use
TOTAL SIZE
Lot Size
Zoning
123,035 SF
99 AC
R-20
Address
Land Use
TOTAL SIZE
Lot Size
Zoning
102,720 SF
4.10 AC
Address
Land Use
TOTAL SIZE
Lot Size
Zoning
6.36 AC
CI
Address
Land Use
TOTAL SIZE
Lot Size
Zoning
112,360 SF
9.29 AC
4046
Address
Land Use
TOTAL SIZE
Lot Size
Zoning
113,436 SF
8.19 AC
2000
Address
Land Use
TOTAL SIZE
Lot Size
Zoning
3,503 SF
65.88 AC
A15
Address
Land Use
TOTAL SIZE
Lot Size
Zoning
77,198 SF
2.16 AC
SMD
Address
Land Use
TOTAL SIZE
Lot Size
Zoning
73,284 SF
11.88 AC
6500
Address
Land Use
TOTAL SIZE
Lot Size
Zoning
2.31 AC
R-6
Address
Land Use
TOTAL SIZE
Lot Size
Zoning
118,269 SF
10.65 AC
5000
Address
Land Use
TOTAL SIZE
Lot Size
Zoning
103,936 SF
2.13 AC
R-6
Address
Land Use
TOTAL SIZE
Lot Size
Zoning
10.46 AC
R-10
Address
Land Use
TOTAL SIZE
Lot Size
Zoning
Address
Land Use
TOTAL SIZE
Lot Size
Zoning
60,000 SF
16.72 AC
2000
Address
Land Use
TOTAL SIZE
Lot Size
Zoning
9,720 SF
12.12 AC
6000
Address
Land Use
TOTAL SIZE
Lot Size
Zoning
100,691 SF
15 AC
R-2A
Address
Land Use
TOTAL SIZE
Lot Size
Zoning
108,722 SF
5.23 AC
6000
Address
Land Use
TOTAL SIZE
Lot Size
Zoning
8.38 AC
R-20
Address
Land Use
TOTAL SIZE
Lot Size
Zoning
8,072 SF
18.12 AC
R-3A
The World's #1 Commercial Real Estate Marketplace
Connect with us
© 2026 CoStar Group
The information above has been obtained from sources believed reliable. While we do not doubt its accuracy we have not verified it and make no guarantee, warranty or representation about it. It is your responsibility to independently confirm its accuracy and completeness. Any projections, opinions, assumptions, or estimates used are for example only and do not represent the current or future performance of the property. The value of this transaction to you depends on tax and other factors which should be evaluated by your tax, financial, and legal advisors. You and your advisors should conduct a careful, independent investigation of the property to determine to your satisfaction the suitability of the property for your needs.