Property Record
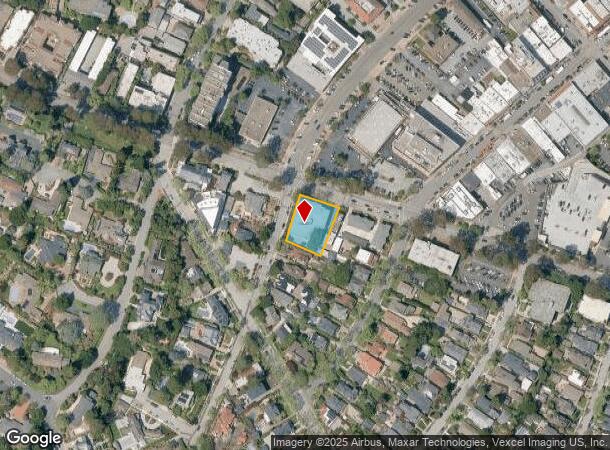
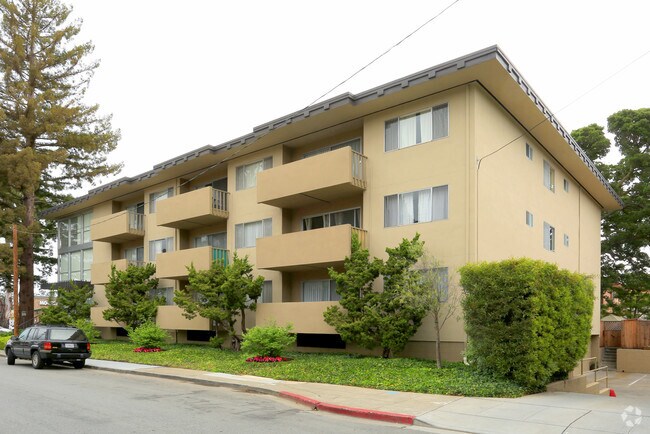
1501 Chapin Ave, Burlingame, CA 94010

NEARBY LISTINGS FOR SALE OR LEASE
Property Detail
1501 Chapin Ave
San Francisco-Redwood City-South San Francisco, CA
Burlingame Park No 2
028-283-190
BEING NWLY PTN OF LOTS 1 4 & 5 BLK 2 BURLINGAME PARK NO 2 RSM B/17
Multifamilydwelling
San Mateo
X
California
06081C0153F
1
2024
0.44 AC
2025
Burlingame Park
605502
San Francisco
35,404 SF
DEMOGRAPHICS near 1501 Chapin Ave
1 Mile
3 Mile
5 Mile
2024 Total Population
25,162
105,203
208,247
2029 Population
24,289
100,655
198,967
Pop Growth 2024-2029
(3.47%)
(4.32%)
(4.46%)
Average Age
41
42
42
2024 Total Households
10,515
39,483
77,620
HH Growth 2024-2029
(3.67%)
(4.52%)
(4.65%)
Median Household Inc
$143,256
$141,205
$145,045
Avg Household Size
2.30
2.60
2.60
2024 Avg HH Vehicles
2.00
2.00
2.00
Median Home Value
$1,124,102
$1,122,196
$1,123,489
Median Year Built
1962
1960
1963
Nearby Places
Map Layers
Map Styles
 Street
 Aerial
- Restaurants
- Banks
- Shops
- Fitness
- Groceries
PUBLIC TRANSPORTATION
COMMUTER RAIL
DRIVE
WALK
Distance
2 min
10 min
0.5 mi
Burlingame (Caltrain - Caltrain (Caltrain))
DRIVE
WALK
Distance
Burlingame (Caltrain - Caltrain (Caltrain))
2 min
11 min
0.5 mi
AIRPORT
San Francisco International
DRIVE
WALK
Distance
San Francisco International
10 min
4.8 mi
Metro Oakland International
DRIVE
WALK
Distance
Metro Oakland International
37 min
28.2 mi
Norman Y Mineta San Jose International
DRIVE
WALK
Distance
Norman Y Mineta San Jose International
38 min
29.6 mi
Freight Ports
Port of Redwood City
DRIVE
WALK
Distance
Port of Redwood City
18 min
12.4 mi
Nearby Properties
Address
Land Use
TOTAL SIZE
Lot Size
Zoning
Address
Land Use
TOTAL SIZE
Lot Size
Zoning
8.65 AC
Address
Land Use
TOTAL SIZE
Lot Size
Zoning
5.73 AC
Address
Land Use
TOTAL SIZE
Lot Size
Zoning
10,000 SF
0.48 AC
ML00M1
Address
Land Use
TOTAL SIZE
Lot Size
Zoning
277,784 SF
10.85 AC
Address
Land Use
TOTAL SIZE
Lot Size
Zoning
260,547 SF
2.23 AC
Address
Land Use
TOTAL SIZE
Lot Size
Zoning
634,000 SF
8.62 AC
M10000
Address
Land Use
TOTAL SIZE
Lot Size
Zoning
5.02 AC
Address
Land Use
TOTAL SIZE
Lot Size
Zoning
19,657 SF
0.69 AC
Address
Land Use
TOTAL SIZE
Lot Size
Zoning
2.83 AC
Address
Land Use
TOTAL SIZE
Lot Size
Zoning
547,306 SF
3.93 AC
Address
Land Use
TOTAL SIZE
Lot Size
Zoning
55,000 SF
1.64 AC
ML00M1
Address
Land Use
TOTAL SIZE
Lot Size
Zoning
85,500 SF
2.20 AC
Address
Land Use
TOTAL SIZE
Lot Size
Zoning
2.57 AC
Address
Land Use
TOTAL SIZE
Lot Size
Zoning
0.93 AC
CL00C2
Address
Land Use
TOTAL SIZE
Lot Size
Zoning
589,128 SF
11.23 AC
Address
Land Use
TOTAL SIZE
Lot Size
Zoning
233,788 SF
3.35 AC
Address
Land Use
TOTAL SIZE
Lot Size
Zoning
5.47 AC
CBD000
Address
Land Use
TOTAL SIZE
Lot Size
Zoning
204,729 SF
2.70 AC
Address
Land Use
TOTAL SIZE
Lot Size
Zoning
319,696 SF
3.12 AC
Address
Land Use
TOTAL SIZE
Lot Size
Zoning
1.27 AC
Address
Land Use
TOTAL SIZE
Lot Size
Zoning
426,540 SF
9.36 AC
C40000
Address
Land Use
TOTAL SIZE
Lot Size
Zoning
661,318 SF
2.08 AC
E10000
Address
Land Use
TOTAL SIZE
Lot Size
Zoning
294,000 SF
6.34 AC
PD0000
Address
Land Use
TOTAL SIZE
Lot Size
Zoning
Address
Land Use
TOTAL SIZE
Lot Size
Zoning
97,762 SF
1.04 AC
MH00M2
Address
Land Use
TOTAL SIZE
Lot Size
Zoning
20.86 AC
Address
Land Use
TOTAL SIZE
Lot Size
Zoning
32,625 SF
1.70 AC
CL00C1
Address
Land Use
TOTAL SIZE
Lot Size
Zoning
1.08 AC
RM00R4
Address
Land Use
TOTAL SIZE
Lot Size
Zoning
139,073 SF
0.73 AC
CL00C1
Address
Land Use
TOTAL SIZE
Lot Size
Zoning
220,008 SF
4.64 AC
C40000
The World's #1 Commercial Real Estate Marketplace
Connect with us
© 2025 CoStar Group
The information above has been obtained from sources believed reliable. While we do not doubt its accuracy we have not verified it and make no guarantee, warranty or representation about it. It is your responsibility to independently confirm its accuracy and completeness. Any projections, opinions, assumptions, or estimates used are for example only and do not represent the current or future performance of the property. The value of this transaction to you depends on tax and other factors which should be evaluated by your tax, financial, and legal advisors. You and your advisors should conduct a careful, independent investigation of the property to determine to your satisfaction the suitability of the property for your needs.