Property Record
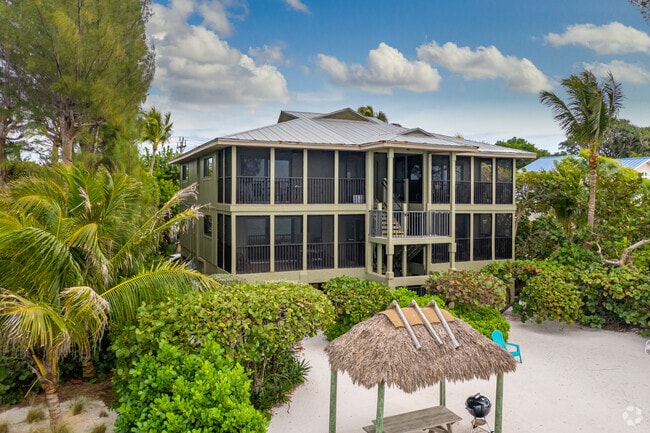
15300 Captiva Dr, Captiva, FL 33924

NEARBY LISTINGS FOR SALE OR LEASE
-
-
View all Captiva listings for sale on LoopNet.com
Property Detail
15300 Captiva Dr
Cape Coral-Fort Myers, FL
Gores A M Subd
35-45-21-01-00000.0140
GORES A M SUBD PB 4 PG 7 LOT 14 + S25 OF LOT 13 + RIPARIAN RIGHTS
Multifamilydwelling
Lee
VE
Florida
12071C0364G
14,13
2024
0.29 AC
2025
Fort Myers Beach/Sanibel Island
080100
Southwest Florida
3,411 SF
DEMOGRAPHICS near 15300 Captiva Dr
1 Mile
3 Mile
5 Mile
2024 Total Population
166
840
1,663
2029 Population
187
1,001
2,012
Pop Growth 2024-2029
+ 12.65%
+ 19.17%
+ 20.99%
Average Age
60
62
62
2024 Total Households
95
449
861
HH Growth 2024-2029
+ 11.58%
+ 18.26%
+ 20.21%
Median Household Inc
$68,999
$72,916
$80,903
Avg Household Size
1.80
1.90
1.90
2024 Avg HH Vehicles
2.00
2.00
2.00
Median Home Value
$427,419
$441,573
$461,507
Median Year Built
1986
1986
1986
Nearby Places
Map Layers
Map Styles
 Street
 Aerial
- Restaurants
- Banks
- Shops
- Fitness
- Groceries
PUBLIC TRANSPORTATION
AIRPORT
Southwest Florida International
DRIVE
WALK
Distance
Southwest Florida International
68 min
34.7 mi
SALE & LEASE HISTORY
LISTING DATE
SALE/LEASE

Feb 26, 2021
For Sale
Nearby Properties
Address
Land Use
TOTAL SIZE
Lot Size
Zoning
Address
Land Use
TOTAL SIZE
Lot Size
Zoning
148,453 SF
10.46 AC
RM-2
Address
Land Use
TOTAL SIZE
Lot Size
Zoning
135,373 SF
38.14 AC
SSRD
Address
Land Use
TOTAL SIZE
Lot Size
Zoning
11,929 SF
2.78 AC
RM-2
Address
Land Use
TOTAL SIZE
Lot Size
Zoning
1,325 SF
5.48 AC
TFC2
Address
Land Use
TOTAL SIZE
Lot Size
Zoning
28,788 SF
3.35 AC
TCF-2
Address
Land Use
TOTAL SIZE
Lot Size
Zoning
18,620 SF
2.09 AC
RSC-2
Address
Land Use
TOTAL SIZE
Lot Size
Zoning
6,925 SF
1.41 AC
RS-2
Address
Land Use
TOTAL SIZE
Lot Size
Zoning
24,127 SF
1.25 AC
RS-2
Address
Land Use
TOTAL SIZE
Lot Size
Zoning
17,913 SF
0.98 AC
TFC2
Address
Land Use
TOTAL SIZE
Lot Size
Zoning
3,445 SF
9.52 AC
C-1
Address
Land Use
TOTAL SIZE
Lot Size
Zoning
18,870 SF
1.23 AC
RS-2
Address
Land Use
TOTAL SIZE
Lot Size
Zoning
11,354 SF
1.38 AC
RPD
Address
Land Use
TOTAL SIZE
Lot Size
Zoning
17,565 SF
2 AC
RS-2
Address
Land Use
TOTAL SIZE
Lot Size
Zoning
23,089 SF
0.99 AC
RS-2
Address
Land Use
TOTAL SIZE
Lot Size
Zoning
14,491 SF
1.99 AC
RS-2
Address
Land Use
TOTAL SIZE
Lot Size
Zoning
34,580 SF
1.60 AC
C-1
Address
Land Use
TOTAL SIZE
Lot Size
Zoning
10,093 SF
1.85 AC
RS-2
Address
Land Use
TOTAL SIZE
Lot Size
Zoning
16,881 SF
1.05 AC
RSC-2
Address
Land Use
TOTAL SIZE
Lot Size
Zoning
68,754 SF
1.31 AC
RM-2
Address
Land Use
TOTAL SIZE
Lot Size
Zoning
11,190 SF
1.71 AC
RS-2
Address
Land Use
TOTAL SIZE
Lot Size
Zoning
11,598 SF
1.06 AC
RS-2
Address
Land Use
TOTAL SIZE
Lot Size
Zoning
13,654 SF
1.15 AC
RS-2
Address
Land Use
TOTAL SIZE
Lot Size
Zoning
9,587 SF
1.37 AC
RSC2
Address
Land Use
TOTAL SIZE
Lot Size
Zoning
Address
Land Use
TOTAL SIZE
Lot Size
Zoning
201.30 AC
AG2
Address
Land Use
TOTAL SIZE
Lot Size
Zoning
12,964 SF
1.13 AC
RS-2
Address
Land Use
TOTAL SIZE
Lot Size
Zoning
4,995 SF
1.80 AC
RS-2
Address
Land Use
TOTAL SIZE
Lot Size
Zoning
11,600 SF
1.11 AC
RS-2
Address
Land Use
TOTAL SIZE
Lot Size
Zoning
12,274 SF
0.66 AC
RM-2
Address
Land Use
TOTAL SIZE
Lot Size
Zoning
11,261 SF
1.05 AC
RS-2
The World's #1 Commercial Real Estate Marketplace
Connect with us
© 2026 CoStar Group
The information above has been obtained from sources believed reliable. While we do not doubt its accuracy we have not verified it and make no guarantee, warranty or representation about it. It is your responsibility to independently confirm its accuracy and completeness. Any projections, opinions, assumptions, or estimates used are for example only and do not represent the current or future performance of the property. The value of this transaction to you depends on tax and other factors which should be evaluated by your tax, financial, and legal advisors. You and your advisors should conduct a careful, independent investigation of the property to determine to your satisfaction the suitability of the property for your needs.