Property Record
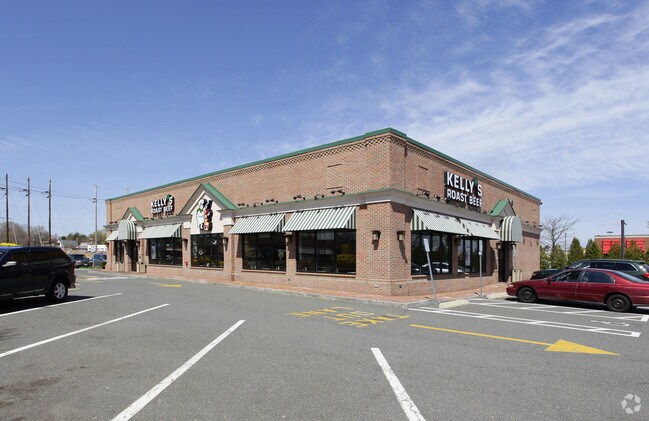
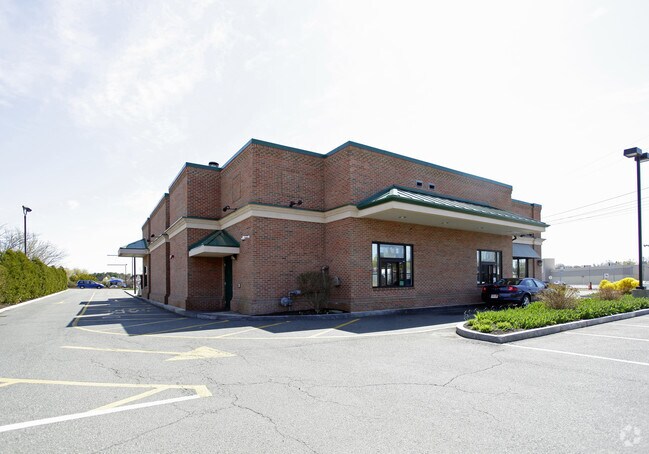
165 Endicott St, Danvers, MA 01923


Property Detail
165 Endicott St
DANV-000063-000000-000018
Essex
Restaurantbuilding
Massachusetts
C3
18
AE The base floodplain where base flood elevations are provided. AE Zones are now used on new format FIRMs instead of A1-A30 Zones.
1.31 AC
2025
Danvers/Beverly
2025
Boston
211201
Boston-Cambridge-Newton, MA-NH
8,678 SF
NEARBY LISTINGS FOR SALE OR LEASE
DEMOGRAPHICS near 165 Endicott St
1 mile
3 mile
5 mile
2025 Total Population
10,525
97,415
216,456
2030 Population
10,744
99,510
221,388
Pop Growth 2025-2030
+ 2.08%
+ 2.15%
+ 2.28%
Average Age
44
43
43
2025 Total Households
4,391
41,105
86,807
HH Growth 2025-2030
+ 1.89%
+ 2.17%
+ 2.25%
Median Household Inc
$97,269
$92,976
$99,936
Avg Household Size
2.30
2.30
2.40
2025 Avg HH Vehicles
2.00
2.00
2.00
Median Home Value
$645,131
$644,925
$669,011
Median Year Built
1965
1961
1960
Nearby Places
Map Layers
Map Styles
 Street
 Aerial
Transit
 Traffic
 Biking
Places
Listings with unknown addresses are not visible on the map
- Restaurants
- Banks
- Shops
- Fitness
- Groceries
PUBLIC TRANSPORTATION
COMMUTER RAIL
Salem (Newburyport/Rockport Line - Massachusetts Bay Transportation Authority Commuter Rail (Purple Line))
Drive
Walk
Distance
Salem (Newburyport/Rockport Line - Massachusetts Bay Transportation Authority Commuter Rail (Purple Line))
11 min
4.2 mi
North Beverly (Newburyport/Rockport Line - Massachusetts Bay Transportation Authority Commuter Rail (Purple Line))
Drive
Walk
Distance
North Beverly (Newburyport/Rockport Line - Massachusetts Bay Transportation Authority Commuter Rail (Purple Line))
9 min
4.9 mi
AIRPORT
General Edward Lawrence Logan International
Drive
Walk
Distance
General Edward Lawrence Logan International
32 min
18.6 mi
Freight Ports
Port of Boston
Drive
Walk
Distance
Port of Boston
35 min
21.6 mi
Nearby Properties
Address
Land Use
TOTAL SIZE
Lot Size
Zoning
Address
Land Use
TOTAL SIZE
Lot Size
Zoning
747,237 SF
36.70 AC
HW
Address
Land Use
TOTAL SIZE
Lot Size
Zoning
48.89 AC
IG
Address
Land Use
TOTAL SIZE
Lot Size
Zoning
10,368 SF
33.83 AC
R3
Address
Land Use
TOTAL SIZE
Lot Size
Zoning
252,965 SF
56.44 AC
R3
Address
Land Use
TOTAL SIZE
Lot Size
Zoning
14.69 AC
I
Address
Land Use
TOTAL SIZE
Lot Size
Zoning
17 AC
R4
Address
Land Use
TOTAL SIZE
Lot Size
Zoning
49 AC
I2
Address
Land Use
TOTAL SIZE
Lot Size
Zoning
17.60 AC
R1A
Address
Land Use
TOTAL SIZE
Lot Size
Zoning
13.04 AC
HC
Address
Land Use
TOTAL SIZE
Lot Size
Zoning
9.71 AC
BR
Address
Land Use
TOTAL SIZE
Lot Size
Zoning
231,509 SF
17.71 AC
R10
Address
Land Use
TOTAL SIZE
Lot Size
Zoning
172.50 AC
R3
Address
Land Use
TOTAL SIZE
Lot Size
Zoning
49.85 AC
R1B
Address
Land Use
TOTAL SIZE
Lot Size
Zoning
182,122 SF
23.33 AC
R10
Address
Land Use
TOTAL SIZE
Lot Size
Zoning
206.65 AC
R1B
Address
Land Use
TOTAL SIZE
Lot Size
Zoning
18.72 AC
R1
Address
Land Use
TOTAL SIZE
Lot Size
Zoning
11.08 AC
R4
Address
Land Use
TOTAL SIZE
Lot Size
Zoning
59.99 AC
IP
Address
Land Use
TOTAL SIZE
Lot Size
Zoning
25.72 AC
IP
Address
Land Use
TOTAL SIZE
Lot Size
Zoning
408,207 SF
37.12 AC
C3
Address
Land Use
TOTAL SIZE
Lot Size
Zoning
4.14 AC
NRCC
Address
Land Use
TOTAL SIZE
Lot Size
Zoning
358,662 SF
36.98 AC
IR
Address
Land Use
TOTAL SIZE
Lot Size
Zoning
28.30 AC
IP
Address
Land Use
TOTAL SIZE
Lot Size
Zoning
162,182 SF
9.53 AC
IR
Address
Land Use
TOTAL SIZE
Lot Size
Zoning
93,789 SF
8.22 AC
HW
Address
Land Use
TOTAL SIZE
Lot Size
Zoning
111.24 AC
R3
Address
Land Use
TOTAL SIZE
Lot Size
Zoning
118,110 SF
0.67 AC
CC
Address
Land Use
TOTAL SIZE
Lot Size
Zoning
37,553 SF
238.29 AC
IR
Address
Land Use
TOTAL SIZE
Lot Size
Zoning
177,782 SF
12.21 AC
I2
Address
Land Use
TOTAL SIZE
Lot Size
Zoning
278,284 SF
23.20 AC
RSD
The World's #1 Commercial Real Estate Marketplace
Connect with us
© 2026 CoStar Group
The information above has been obtained from sources believed reliable. While we do not doubt its accuracy we have not verified it and make no guarantee, warranty or representation about it. It is your responsibility to independently confirm its accuracy and completeness. Any projections, opinions, assumptions, or estimates used are for example only and do not represent the current or future performance of the property. The value of this transaction to you depends on tax and other factors which should be evaluated by your tax, financial, and legal advisors. You and your advisors should conduct a careful, independent investigation of the property to determine to your satisfaction the suitability of the property for your needs.