Property Record
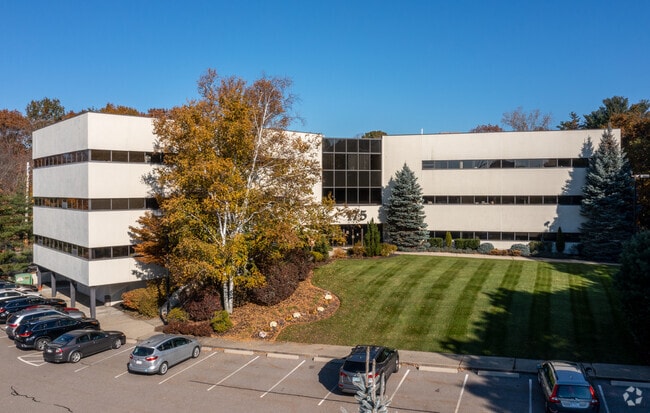
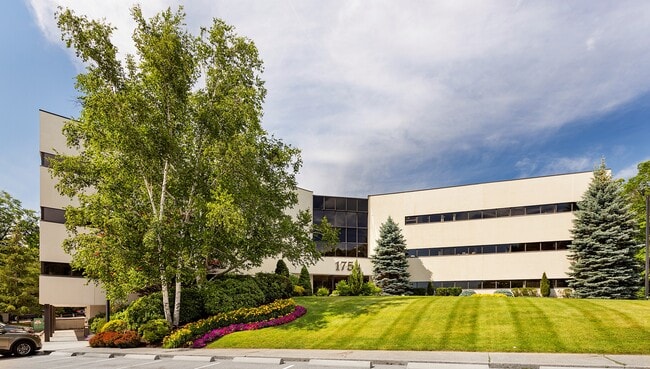
175 Andover St, Danvers, MA 01923


Current Lease Availabilities
Property Detail
175 Andover St
DANV-000048-000000-000032
Essex
Officebuilding
Massachusetts
HC
32
B and X Area of moderate flood hazard, usually the area between the limits of the 100-year and 500-year floods.
1.65 AC
2025
Danvers/Beverly
2025
Boston
211402
Boston-Cambridge-Newton, MA-NH
30,390 SF
NEARBY LISTINGS FOR SALE OR LEASE
DEMOGRAPHICS near 175 Andover St
1 mile
3 mile
5 mile
2024 Total Population
9,016
62,042
172,294
2029 Population
9,323
63,734
176,774
Pop Growth 2024-2029
+ 3.41%
+ 2.73%
+ 2.60%
Average Age
51
45
43
2024 Total Households
4,510
24,975
69,199
HH Growth 2024-2029
+ 3.86%
+ 2.77%
+ 2.57%
Median Household Inc
$85,852
$109,339
$106,311
Avg Household Size
1.90
2.40
2.40
2024 Avg HH Vehicles
1.00
2.00
2.00
Median Home Value
$505,374
$675,688
$693,314
Median Year Built
1989
1969
1964
Nearby Places
Map Layers
Map Styles
 Street
 Aerial
Transit
 Traffic
 Biking
Places
Listings with unknown addresses are not visible on the map
- Restaurants
- Banks
- Shops
- Fitness
- Groceries
PUBLIC TRANSPORTATION
COMMUTER RAIL
Salem (Newburyport/Rockport Line - Massachusetts Bay Transportation Authority Commuter Rail (Purple Line))
Drive
Walk
Distance
Salem (Newburyport/Rockport Line - Massachusetts Bay Transportation Authority Commuter Rail (Purple Line))
14 min
6.1 mi
Beverly Depot (Newburyport/Rockport Line - Massachusetts Bay Transportation Authority Commuter Rail (Purple Line))
Drive
Walk
Distance
Beverly Depot (Newburyport/Rockport Line - Massachusetts Bay Transportation Authority Commuter Rail (Purple Line))
12 min
6.4 mi
AIRPORT
General Edward Lawrence Logan International
Drive
Walk
Distance
General Edward Lawrence Logan International
28 min
16.8 mi
Freight Ports
Port of Boston
Drive
Walk
Distance
Port of Boston
31 min
19.8 mi
Nearby Properties
Address
Land Use
TOTAL SIZE
Lot Size
Zoning
Address
Land Use
TOTAL SIZE
Lot Size
Zoning
747,237 SF
36.70 AC
HW
Address
Land Use
TOTAL SIZE
Lot Size
Zoning
10,368 SF
33.83 AC
R3
Address
Land Use
TOTAL SIZE
Lot Size
Zoning
252,965 SF
56.44 AC
R3
Address
Land Use
TOTAL SIZE
Lot Size
Zoning
17 AC
R4
Address
Land Use
TOTAL SIZE
Lot Size
Zoning
198.74 AC
R3
Address
Land Use
TOTAL SIZE
Lot Size
Zoning
49 AC
I2
Address
Land Use
TOTAL SIZE
Lot Size
Zoning
17.60 AC
R1A
Address
Land Use
TOTAL SIZE
Lot Size
Zoning
13.04 AC
HC
Address
Land Use
TOTAL SIZE
Lot Size
Zoning
9.71 AC
BR
Address
Land Use
TOTAL SIZE
Lot Size
Zoning
49.85 AC
R1B
Address
Land Use
TOTAL SIZE
Lot Size
Zoning
101,389 SF
20 AC
I
Address
Land Use
TOTAL SIZE
Lot Size
Zoning
65.79 AC
I1
Address
Land Use
TOTAL SIZE
Lot Size
Zoning
40.20 AC
R1B
Address
Land Use
TOTAL SIZE
Lot Size
Zoning
206.65 AC
R1B
Address
Land Use
TOTAL SIZE
Lot Size
Zoning
54,302 SF
83.70 AC
R3
Address
Land Use
TOTAL SIZE
Lot Size
Zoning
11.08 AC
R4
Address
Land Use
TOTAL SIZE
Lot Size
Zoning
249,587 SF
5.79 AC
DDD
Address
Land Use
TOTAL SIZE
Lot Size
Zoning
59.99 AC
IP
Address
Land Use
TOTAL SIZE
Lot Size
Zoning
25.72 AC
IP
Address
Land Use
TOTAL SIZE
Lot Size
Zoning
408,207 SF
37.12 AC
C3
Address
Land Use
TOTAL SIZE
Lot Size
Zoning
93,789 SF
8.22 AC
HW
Address
Land Use
TOTAL SIZE
Lot Size
Zoning
111.24 AC
R3
Address
Land Use
TOTAL SIZE
Lot Size
Zoning
24.37 AC
C3
Address
Land Use
TOTAL SIZE
Lot Size
Zoning
20.78 AC
C3
Address
Land Use
TOTAL SIZE
Lot Size
Zoning
19.10 AC
R114
Address
Land Use
TOTAL SIZE
Lot Size
Zoning
15.32 AC
HC
Address
Land Use
TOTAL SIZE
Lot Size
Zoning
71.68 AC
R3
Address
Land Use
TOTAL SIZE
Lot Size
Zoning
15.16 AC
I2
Address
Land Use
TOTAL SIZE
Lot Size
Zoning
12.57 AC
IH
Address
Land Use
TOTAL SIZE
Lot Size
Zoning
158,572 SF
10 AC
I2
The World's #1 Commercial Real Estate Marketplace
Connect with us
© 2026 CoStar Group
The information above has been obtained from sources believed reliable. While we do not doubt its accuracy we have not verified it and make no guarantee, warranty or representation about it. It is your responsibility to independently confirm its accuracy and completeness. Any projections, opinions, assumptions, or estimates used are for example only and do not represent the current or future performance of the property. The value of this transaction to you depends on tax and other factors which should be evaluated by your tax, financial, and legal advisors. You and your advisors should conduct a careful, independent investigation of the property to determine to your satisfaction the suitability of the property for your needs.