Property Record
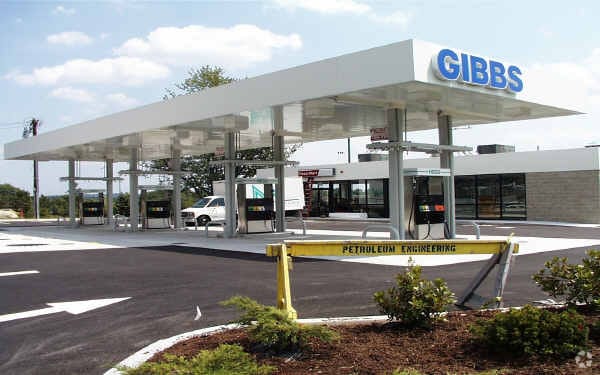
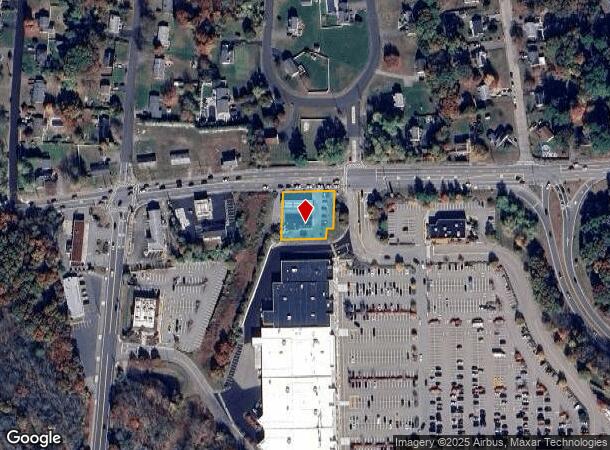
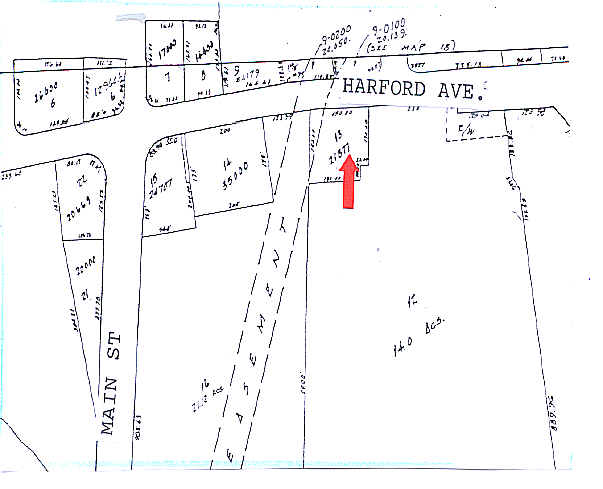
199 Hartford Ave, Bellingham, MA 02019
NEARBY LISTINGS FOR SALE OR LEASE
Property Detail
199 Hartford Ave
Servicestation
Norfolk
X
Massachusetts
25027C1055F
0.52 AC
2025
I-95 Corridor South
2025
Boston
443106
Boston-Cambridge-Newton, MA-NH
2,250 SF
BELL-000024-000013
DEMOGRAPHICS near 199 Hartford Ave
1 Mile
3 Mile
5 Mile
2024 Total Population
3,288
27,577
89,635
2029 Population
3,270
27,414
89,113
Pop Growth 2024-2029
(0.55%)
(0.59%)
(0.58%)
Average Age
43
41
41
2024 Total Households
1,309
10,147
33,265
HH Growth 2024-2029
(0.53%)
(0.65%)
(0.63%)
Median Household Inc
$85,616
$119,637
$116,747
Avg Household Size
2.50
2.70
2.60
2024 Avg HH Vehicles
2.00
2.00
2.00
Median Home Value
$377,231
$441,976
$455,717
Median Year Built
1971
1981
1975
Nearby Places
Map Layers
Map Styles
 Street
 Aerial
- Restaurants
- Banks
- Shops
- Fitness
- Groceries
PUBLIC TRANSPORTATION
COMMUTER RAIL
Forge Park/Route 495 (Franklin Line - Massachusetts Bay Transportation Authority Commuter Rail (Purple Line))
DRIVE
WALK
Distance
Forge Park/Route 495 (Franklin Line - Massachusetts Bay Transportation Authority Commuter Rail (Purple Line))
6 min
3.5 mi
Franklin (Franklin Line - Massachusetts Bay Transportation Authority Commuter Rail (Purple Line))
DRIVE
WALK
Distance
Franklin (Franklin Line - Massachusetts Bay Transportation Authority Commuter Rail (Purple Line))
9 min
4.8 mi
AIRPORT
Rhode Island Tf Green International
DRIVE
WALK
Distance
Rhode Island Tf Green International
48 min
30.7 mi
Worcester Regional
DRIVE
WALK
Distance
Worcester Regional
49 min
32.0 mi
General Edward Lawrence Logan International
DRIVE
WALK
Distance
General Edward Lawrence Logan International
59 min
44.9 mi
Freight Ports
Port of Davisville, RI
DRIVE
WALK
Distance
Port of Davisville, RI
60 min
42.5 mi
Nearby Properties
Address
Land Use
TOTAL SIZE
Lot Size
Zoning
Address
Land Use
TOTAL SIZE
Lot Size
Zoning
20.97 AC
CRPC
Address
Land Use
TOTAL SIZE
Lot Size
Zoning
322,615 SF
17.33 AC
SUBN
Address
Land Use
TOTAL SIZE
Lot Size
Zoning
14.82 AC
AGR
Address
Land Use
TOTAL SIZE
Lot Size
Zoning
279,174 SF
59.96 AC
Address
Land Use
TOTAL SIZE
Lot Size
Zoning
345,000 SF
60.44 AC
BUS1
Address
Land Use
TOTAL SIZE
Lot Size
Zoning
616,875 SF
141 AC
LI
Address
Land Use
TOTAL SIZE
Lot Size
Zoning
183,839 SF
39.29 AC
IND
Address
Land Use
TOTAL SIZE
Lot Size
Zoning
300,000 SF
64.63 AC
IND
Address
Land Use
TOTAL SIZE
Lot Size
Zoning
231,817 SF
35.01 AC
IND
Address
Land Use
TOTAL SIZE
Lot Size
Zoning
253,656 SF
44.84 AC
IND
Address
Land Use
TOTAL SIZE
Lot Size
Zoning
24.81 AC
IB
Address
Land Use
TOTAL SIZE
Lot Size
Zoning
238,602 SF
109.37 AC
Address
Land Use
TOTAL SIZE
Lot Size
Zoning
238,975 SF
33.82 AC
IND
Address
Land Use
TOTAL SIZE
Lot Size
Zoning
451,000 SF
90.70 AC
IND
Address
Land Use
TOTAL SIZE
Lot Size
Zoning
27.32 AC
IB
Address
Land Use
TOTAL SIZE
Lot Size
Zoning
347,012 SF
29.23 AC
IB
Address
Land Use
TOTAL SIZE
Lot Size
Zoning
208,826 SF
18.96 AC
IND
Address
Land Use
TOTAL SIZE
Lot Size
Zoning
120,327 SF
28.75 AC
BUS2
Address
Land Use
TOTAL SIZE
Lot Size
Zoning
241,740 SF
14.60 AC
Address
Land Use
TOTAL SIZE
Lot Size
Zoning
7.36 AC
RA
Address
Land Use
TOTAL SIZE
Lot Size
Zoning
19.14 AC
IB
Address
Land Use
TOTAL SIZE
Lot Size
Zoning
127,500 SF
22.01 AC
IND
Address
Land Use
TOTAL SIZE
Lot Size
Zoning
113,044 SF
71.52 AC
B
Address
Land Use
TOTAL SIZE
Lot Size
Zoning
165,132 SF
24.49 AC
IN3
Address
Land Use
TOTAL SIZE
Lot Size
Zoning
51.71 AC
CRPC
Address
Land Use
TOTAL SIZE
Lot Size
Zoning
106.49 AC
IB
Address
Land Use
TOTAL SIZE
Lot Size
Zoning
108,202 SF
17.07 AC
CRPC
Address
Land Use
TOTAL SIZE
Lot Size
Zoning
14 AC
IB
Address
Land Use
TOTAL SIZE
Lot Size
Zoning
124,320 SF
10 AC
BUS1
Address
Land Use
TOTAL SIZE
Lot Size
Zoning
272,941 SF
34.05 AC
IB
The World's #1 Commercial Real Estate Marketplace
Connect with us
© 2025 CoStar Group
The information above has been obtained from sources believed reliable. While we do not doubt its accuracy we have not verified it and make no guarantee, warranty or representation about it. It is your responsibility to independently confirm its accuracy and completeness. Any projections, opinions, assumptions, or estimates used are for example only and do not represent the current or future performance of the property. The value of this transaction to you depends on tax and other factors which should be evaluated by your tax, financial, and legal advisors. You and your advisors should conduct a careful, independent investigation of the property to determine to your satisfaction the suitability of the property for your needs.