Property Record
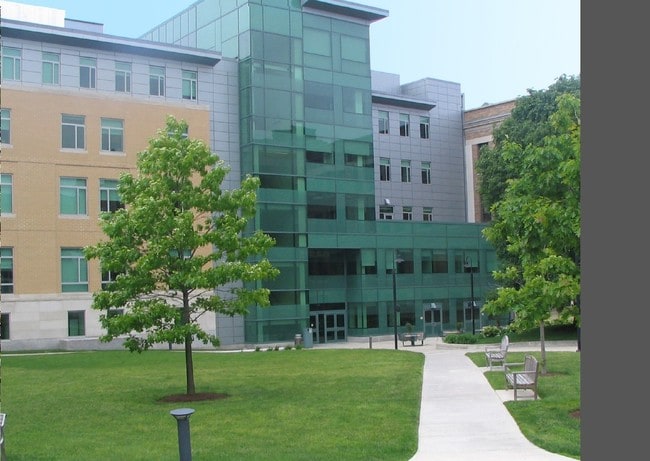
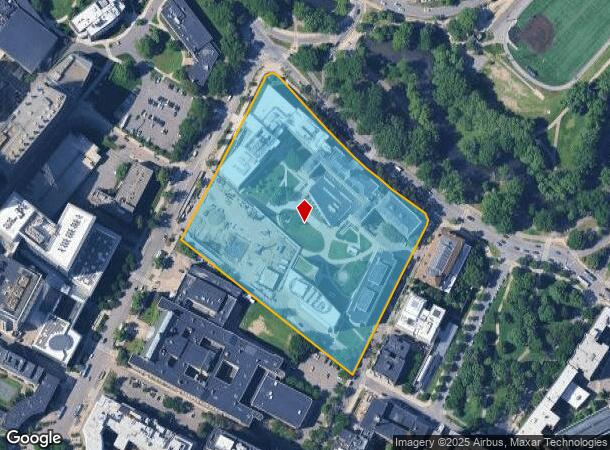
300 Fenway, Boston, MA 02115
Current Lease Availabilities
NEARBY LISTINGS FOR SALE OR LEASE
-
-
-
-
-
-
No Photo
-
-
View all Boston listings for lease on LoopNet.com
Property Detail
300 Fenway
Publicschool
Suffolk
AE
Massachusetts
25021C0053F
7.32 AC
0
Longwood/Fenway
2025
Boston
010300
Boston-Cambridge-Newton, MA-NH
596,972 SF
CBOS-000000-000004-001842
DEMOGRAPHICS near 300 Fenway
1 Mile
3 Mile
5 Mile
2024 Total Population
91,747
516,730
937,702
2029 Population
88,950
499,796
904,322
Pop Growth 2024-2029
(3.05%)
(3.28%)
(3.56%)
Average Age
32
36
37
2024 Total Households
33,793
222,196
391,919
HH Growth 2024-2029
(3.28%)
(3.51%)
(3.79%)
Median Household Inc
$55,932
$87,628
$95,528
Avg Household Size
1.90
2.00
2.20
2024 Avg HH Vehicles
1.00
1.00
1.00
Median Home Value
$871,925
$872,709
$818,336
Median Year Built
1960
1953
1949
Nearby Places
- Restaurants
- Banks
- Shops
- Fitness
- Groceries
PUBLIC TRANSPORTATION
TRANSIT/SUBWAY
Museum Of Fine Arts Station (Green Line - E - Massachusetts Bay Transportation Authority Subway (The T))
DRIVE
WALK
Distance
Museum Of Fine Arts Station (Green Line - E - Massachusetts Bay Transportation Authority Subway (The T))
0 min
6 min
0.3 mi
Longwood Medical Area Station (Green Line - E - Massachusetts Bay Transportation Authority Subway (The T))
DRIVE
WALK
Distance
Longwood Medical Area Station (Green Line - E - Massachusetts Bay Transportation Authority Subway (The T))
1 min
5 min
0.3 mi
Brigham Circle Station (Green Line - E - Massachusetts Bay Transportation Authority Subway (The T))
DRIVE
WALK
Distance
Brigham Circle Station (Green Line - E - Massachusetts Bay Transportation Authority Subway (The T))
1 min
8 min
0.4 mi
Fenwood Road Station (Green Line - E - Massachusetts Bay Transportation Authority Subway (The T))
DRIVE
WALK
Distance
Fenwood Road Station (Green Line - E - Massachusetts Bay Transportation Authority Subway (The T))
1 min
11 min
0.6 mi
Fenway Station (Green Line - D - Massachusetts Bay Transportation Authority Subway (The T))
DRIVE
WALK
Distance
Fenway Station (Green Line - D - Massachusetts Bay Transportation Authority Subway (The T))
2 min
11 min
0.6 mi
COMMUTER RAIL
Ruggles Station (Franklin Line - Massachusetts Bay Transportation Authority Commuter Rail (Purple Line), Needham Line - Massachusetts Bay Transportation Authority Commuter Rail (Purple Line), Orange Line - Massachusetts Bay Transportation Authority Commuter Rail (Purple Line), Providence/Stoughton Line - Massachusetts Bay Transportation Authority Commuter Rail (Purple Line))
DRIVE
WALK
Distance
Ruggles Station (Franklin Line - Massachusetts Bay Transportation Authority Commuter Rail (Purple Line), Needham Line - Massachusetts Bay Transportation Authority Commuter Rail (Purple Line), Orange Line - Massachusetts Bay Transportation Authority Commuter Rail (Purple Line), Providence/Stoughton Line - Massachusetts Bay Transportation Authority Commuter Rail (Purple Line))
2 min
13 min
0.7 mi
Yawkey (Framingham/Worcester Line - Massachusetts Bay Transportation Authority Commuter Rail (Purple Line))
DRIVE
WALK
Distance
Yawkey (Framingham/Worcester Line - Massachusetts Bay Transportation Authority Commuter Rail (Purple Line))
8 min
16 min
0.8 mi
AIRPORT
General Edward Lawrence Logan International
DRIVE
WALK
Distance
General Edward Lawrence Logan International
13 min
6.7 mi
Freight Ports
Port of Boston
DRIVE
WALK
Distance
Port of Boston
12 min
5.0 mi
Nearby Properties
Address
Land Use
TOTAL SIZE
Lot Size
Zoning
Address
Land Use
TOTAL SIZE
Lot Size
Zoning
909,764 SF
25.13 AC
E
Address
Land Use
TOTAL SIZE
Lot Size
Zoning
610,560 SF
4.01 AC
E
Address
Land Use
TOTAL SIZE
Lot Size
Zoning
439,500 SF
9.21 AC
E
Address
Land Use
TOTAL SIZE
Lot Size
Zoning
125,571 SF
3.25 AC
C-3
Address
Land Use
TOTAL SIZE
Lot Size
Zoning
150,192 SF
10.27 AC
E
Address
Land Use
TOTAL SIZE
Lot Size
Zoning
6.39 AC
C
Address
Land Use
TOTAL SIZE
Lot Size
Zoning
530,200 SF
62.08 AC
E
Address
Land Use
TOTAL SIZE
Lot Size
Zoning
173,400 SF
1.14 AC
MXD
Address
Land Use
TOTAL SIZE
Lot Size
Zoning
142,458 SF
1.67 AC
C-3
Address
Land Use
TOTAL SIZE
Lot Size
Zoning
334,522 SF
1.26 AC
C
Address
Land Use
TOTAL SIZE
Lot Size
Zoning
312,269 SF
0.43 AC
C
Address
Land Use
TOTAL SIZE
Lot Size
Zoning
230,394 SF
0.60 AC
MXD
Address
Land Use
TOTAL SIZE
Lot Size
Zoning
46,259 SF
1.05 AC
E
Address
Land Use
TOTAL SIZE
Lot Size
Zoning
118,759 SF
0.92 AC
C
Address
Land Use
TOTAL SIZE
Lot Size
Zoning
304,349 SF
1.72 AC
Address
Land Use
TOTAL SIZE
Lot Size
Zoning
3.52 AC
C-3
Address
Land Use
TOTAL SIZE
Lot Size
Zoning
377,634 SF
4.86 AC
E
Address
Land Use
TOTAL SIZE
Lot Size
Zoning
1.13 AC
C
Address
Land Use
TOTAL SIZE
Lot Size
Zoning
239,377 SF
0.71 AC
MXD
Address
Land Use
TOTAL SIZE
Lot Size
Zoning
419,722 SF
2.03 AC
RC
Address
Land Use
TOTAL SIZE
Lot Size
Zoning
227,107 SF
7.70 AC
E
Address
Land Use
TOTAL SIZE
Lot Size
Zoning
2.81 AC
O-2
Address
Land Use
TOTAL SIZE
Lot Size
Zoning
448,796 SF
1.84 AC
C
Address
Land Use
TOTAL SIZE
Lot Size
Zoning
254,208 SF
3.83 AC
E
Address
Land Use
TOTAL SIZE
Lot Size
Zoning
4,355 SF
13.12 AC
E
Address
Land Use
TOTAL SIZE
Lot Size
Zoning
252,392 SF
0.52 AC
C
Address
Land Use
TOTAL SIZE
Lot Size
Zoning
262,120 SF
0.62 AC
C
Address
Land Use
TOTAL SIZE
Lot Size
Zoning
237,935 SF
1.27 AC
C-3
Address
Land Use
TOTAL SIZE
Lot Size
Zoning
619,050 SF
0.45 AC
C
The World's #1 Commercial Real Estate Marketplace
Connect with us
© 2025 CoStar Group
The information above has been obtained from sources believed reliable. While we do not doubt its accuracy we have not verified it and make no guarantee, warranty or representation about it. It is your responsibility to independently confirm its accuracy and completeness. Any projections, opinions, assumptions, or estimates used are for example only and do not represent the current or future performance of the property. The value of this transaction to you depends on tax and other factors which should be evaluated by your tax, financial, and legal advisors. You and your advisors should conduct a careful, independent investigation of the property to determine to your satisfaction the suitability of the property for your needs.