Property Record
203 E 2100 S, Salt Lake City, UT 84115


NEARBY LISTINGS FOR SALE OR LEASE
Property Detail
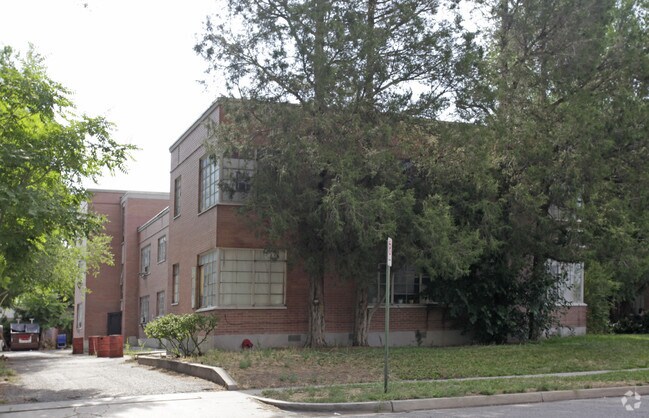
203 E 2100 S
Salt Lake City, UT
Finnegan
16-18-382-019-0000
BEG N 89^5223 E 32.99 FT FR SW COR LOT 1, BLK 5, 5 AC PLATA, BF SUR; N 0^1340 E 441.33 FT; N 89^5230 E 156.19 FT; S 0^0951 W 305.4 FT; W 72.2 FT; S 0^1340 W 136.08 FT; S 89^5223 W 84.33 FT TO BEG. 8229-1072 8263-2050 10097-8216 10311-2348 10423-1583
Apartment
Salt Lake
X
Utah
49035C0282H
1
2024
1.36 AC
2025
Liberty Wells
103200
Salt Lake City
21,293 SF
DEMOGRAPHICS near 203 E 2100 S
1 Mile
3 Mile
5 Mile
2024 Total Population
19,847
154,985
359,049
2029 Population
20,111
157,482
364,052
Pop Growth 2024-2029
+ 1.33%
+ 1.61%
+ 1.39%
Average Age
38
37
37
2024 Total Households
9,153
68,919
148,328
HH Growth 2024-2029
+ 1.45%
+ 2.01%
+ 1.69%
Median Household Inc
$58,892
$63,145
$64,688
Avg Household Size
2.10
2.10
2.30
2024 Avg HH Vehicles
2.00
2.00
2.00
Median Home Value
$422,676
$464,139
$459,685
Median Year Built
1959
1966
1972
Nearby Places
Map Layers
Map Styles
 Street
 Aerial
- Restaurants
- Banks
- Shops
- Fitness
- Groceries
PUBLIC TRANSPORTATION
TRANSIT/SUBWAY
300 East Station (S-Line - Utah Transit Authority (UTA))
DRIVE
WALK
Distance
300 East Station (S-Line - Utah Transit Authority (UTA))
1 min
8 min
0.4 mi
South Salt Lake City Station (S-Line - Utah Transit Authority (UTA))
DRIVE
WALK
Distance
South Salt Lake City Station (S-Line - Utah Transit Authority (UTA))
1 min
10 min
0.5 mi
500 East Station (S-Line - Utah Transit Authority (UTA))
DRIVE
WALK
Distance
500 East Station (S-Line - Utah Transit Authority (UTA))
2 min
13 min
0.7 mi
Central Pointe (TRAX Murray/Midvale/University Line - Utah Transit Authority (UTA), TRAX Salt Lake/Sandy Line - Utah Transit Authority (UTA))
DRIVE
WALK
Distance
Central Pointe (TRAX Murray/Midvale/University Line - Utah Transit Authority (UTA), TRAX Salt Lake/Sandy Line - Utah Transit Authority (UTA))
2 min
14 min
0.8 mi
700 East Station (S-Line - Utah Transit Authority (UTA))
DRIVE
WALK
Distance
700 East Station (S-Line - Utah Transit Authority (UTA))
2 min
18 min
1.0 mi
COMMUTER RAIL
North Temple Station (FrontRunner - Utah Transit Authority (UTA))
DRIVE
WALK
Distance
North Temple Station (FrontRunner - Utah Transit Authority (UTA))
10 min
4.8 mi
Warm Springs Relief Point (FrontRunner - Utah Transit Authority (UTA))
DRIVE
WALK
Distance
Warm Springs Relief Point (FrontRunner - Utah Transit Authority (UTA))
11 min
6.2 mi
AIRPORT
Salt Lake City International
DRIVE
WALK
Distance
Salt Lake City International
14 min
8.8 mi
Freight Ports
Port of Stockton
DRIVE
WALK
Distance
Port of Stockton
714 min
699.2 mi
SALE & LEASE HISTORY
LISTING DATE
SALE/LEASE

Mar 01, 2019
For Sale
Nearby Properties
Address
Land Use
TOTAL SIZE
Lot Size
Zoning
Address
Land Use
TOTAL SIZE
Lot Size
Zoning
1,115,174 SF
9.72 AC
D-4
Address
Land Use
TOTAL SIZE
Lot Size
Zoning
56,741 SF
1.70 AC
D-1
Address
Land Use
TOTAL SIZE
Lot Size
Zoning
87,933 SF
4.90 AC
D-1
Address
Land Use
TOTAL SIZE
Lot Size
Zoning
2,566,335 SF
10.01 AC
D-1
Address
Land Use
TOTAL SIZE
Lot Size
Zoning
1,330,058 SF
5.02 AC
D2
Address
Land Use
TOTAL SIZE
Lot Size
Zoning
298,628 SF
27.30 AC
I
Address
Land Use
TOTAL SIZE
Lot Size
Zoning
807,940 SF
0.69 AC
D1
Address
Land Use
TOTAL SIZE
Lot Size
Zoning
488,509 SF
36.03 AC
FLEX
Address
Land Use
TOTAL SIZE
Lot Size
Zoning
712,539 SF
0.01 AC
D1
Address
Land Use
TOTAL SIZE
Lot Size
Zoning
1,256,042 SF
3.50 AC
D-1
Address
Land Use
TOTAL SIZE
Lot Size
Zoning
82,851 SF
9.76 AC
PL2
Address
Land Use
TOTAL SIZE
Lot Size
Zoning
588,291 SF
1.28 AC
D-1
Address
Land Use
TOTAL SIZE
Lot Size
Zoning
434,481 SF
10 AC
D-1
Address
Land Use
TOTAL SIZE
Lot Size
Zoning
497,018 SF
13.11 AC
I
Address
Land Use
TOTAL SIZE
Lot Size
Zoning
163,932 SF
14.65 AC
PL
Address
Land Use
TOTAL SIZE
Lot Size
Zoning
449,528 SF
1.64 AC
2000
Address
Land Use
TOTAL SIZE
Lot Size
Zoning
543,780 SF
0.33 AC
D1
Address
Land Use
TOTAL SIZE
Lot Size
Zoning
737,755 SF
1.63 AC
D-1
Address
Land Use
TOTAL SIZE
Lot Size
Zoning
37,536 SF
10 AC
PL
Address
Land Use
TOTAL SIZE
Lot Size
Zoning
208,868 SF
20.41 AC
I
Address
Land Use
TOTAL SIZE
Lot Size
Zoning
695,737 SF
1.70 AC
D-1
Address
Land Use
TOTAL SIZE
Lot Size
Zoning
136,387 SF
6.77 AC
D-4
Address
Land Use
TOTAL SIZE
Lot Size
Zoning
398,351 SF
1.57 AC
D-1
Address
Land Use
TOTAL SIZE
Lot Size
Zoning
128,997 SF
3.04 AC
ESN
Address
Land Use
TOTAL SIZE
Lot Size
Zoning
542,678 SF
0.75 AC
X
Address
Land Use
TOTAL SIZE
Lot Size
Zoning
35,720 SF
0.55 AC
D-1
Address
Land Use
TOTAL SIZE
Lot Size
Zoning
297,476 SF
1.62 AC
CSHBD2
Address
Land Use
TOTAL SIZE
Lot Size
Zoning
549,074 SF
3.45 AC
D-1
Address
Land Use
TOTAL SIZE
Lot Size
Zoning
680,751 SF
1.45 AC
TSA-UC
Address
Land Use
TOTAL SIZE
Lot Size
Zoning
369,717 SF
2.50 AC
RO
The World's #1 Commercial Real Estate Marketplace
Connect with us
© 2026 CoStar Group
The information above has been obtained from sources believed reliable. While we do not doubt its accuracy we have not verified it and make no guarantee, warranty or representation about it. It is your responsibility to independently confirm its accuracy and completeness. Any projections, opinions, assumptions, or estimates used are for example only and do not represent the current or future performance of the property. The value of this transaction to you depends on tax and other factors which should be evaluated by your tax, financial, and legal advisors. You and your advisors should conduct a careful, independent investigation of the property to determine to your satisfaction the suitability of the property for your needs.