Property Record
277 E 900 S, Salt Lake City, UT 84111


NEARBY LISTINGS FOR SALE OR LEASE
Property Detail
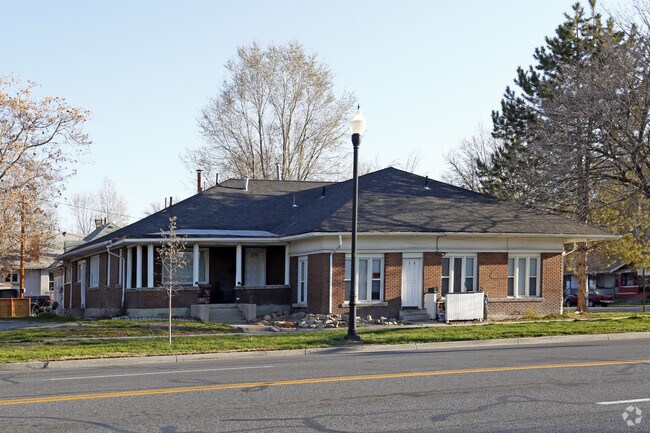
277 E 900 S
Salt Lake City, UT
Salt Lake City Survey Plat A
16-07-178-032-0000
BEG AT SE COR LOT 1, BLK 1, PLAT A, SLC SUR; W 101 FT; N 5 RDS; E 101 FT; S 5 RDS TO BEG. 4611-625 4611-0626 5339-1005 5533-1321 5591-0246 7052-2369 7866-2586 8263-6133 8515-1389 8991-7889 9229-4336 9247-2584 9277-5580 9999-8775 10457-713310531-9034
Apartment
Salt Lake
X
Utah
49035C0144H
1
2024
0.19 AC
2025
Central Salt Lake City
102300
Salt Lake City
7,244 SF
DEMOGRAPHICS near 277 E 900 S
1 Mile
3 Mile
5 Mile
2024 Total Population
24,674
159,957
285,933
2029 Population
25,406
162,818
290,139
Pop Growth 2024-2029
+ 2.97%
+ 1.79%
+ 1.47%
Average Age
37
37
37
2024 Total Households
12,662
73,458
119,722
HH Growth 2024-2029
+ 3.43%
+ 2.25%
+ 1.83%
Median Household Inc
$50,771
$61,838
$64,136
Avg Household Size
1.80
2.00
2.20
2024 Avg HH Vehicles
1.00
2.00
2.00
Median Home Value
$453,783
$493,446
$466,113
Median Year Built
1975
1965
1970
Nearby Places
Map Layers
Map Styles
 Street
 Aerial
- Restaurants
- Banks
- Shops
- Fitness
- Groceries
PUBLIC TRANSPORTATION
TRANSIT/SUBWAY
900 South (TRAX Murray/Midvale/University Line - Utah Transit Authority (UTA), TRAX Salt Lake/Sandy Line - Utah Transit Authority (UTA))
DRIVE
WALK
Distance
900 South (TRAX Murray/Midvale/University Line - Utah Transit Authority (UTA), TRAX Salt Lake/Sandy Line - Utah Transit Authority (UTA))
2 min
15 min
0.8 mi
600 South Station (Red Line - Utah Transit Authority (UTA))
DRIVE
WALK
Distance
600 South Station (Red Line - Utah Transit Authority (UTA))
3 min
15 min
0.8 mi
Main Library (TRAX Murray/Midvale/University Line - Utah Transit Authority (UTA), TRAX University Line - Utah Transit Authority (UTA))
DRIVE
WALK
Distance
Main Library (TRAX Murray/Midvale/University Line - Utah Transit Authority (UTA), TRAX University Line - Utah Transit Authority (UTA))
2 min
17 min
0.9 mi
Courthouse (TRAX Murray/Midvale/University Line - Utah Transit Authority (UTA), TRAX Salt Lake/Sandy Line - Utah Transit Authority (UTA))
DRIVE
WALK
Distance
Courthouse (TRAX Murray/Midvale/University Line - Utah Transit Authority (UTA), TRAX Salt Lake/Sandy Line - Utah Transit Authority (UTA))
4 min
20 min
1.1 mi
COMMUTER RAIL
North Temple Station (FrontRunner - Utah Transit Authority (UTA))
DRIVE
WALK
Distance
North Temple Station (FrontRunner - Utah Transit Authority (UTA))
8 min
2.8 mi
Warm Springs Relief Point (FrontRunner - Utah Transit Authority (UTA))
DRIVE
WALK
Distance
Warm Springs Relief Point (FrontRunner - Utah Transit Authority (UTA))
10 min
4.1 mi
AIRPORT
Salt Lake City International
DRIVE
WALK
Distance
Salt Lake City International
13 min
7.6 mi
Freight Ports
Port of Stockton
DRIVE
WALK
Distance
Port of Stockton
714 min
698.0 mi
Nearby Properties
Address
Land Use
TOTAL SIZE
Lot Size
Zoning
Address
Land Use
TOTAL SIZE
Lot Size
Zoning
2,287,331 SF
137 AC
I
Address
Land Use
TOTAL SIZE
Lot Size
Zoning
1,260,285 SF
59.07 AC
I
Address
Land Use
TOTAL SIZE
Lot Size
Zoning
591,924 SF
80.77 AC
I
Address
Land Use
TOTAL SIZE
Lot Size
Zoning
298,342 SF
13.71 AC
I
Address
Land Use
TOTAL SIZE
Lot Size
Zoning
1,262,865 SF
44.15 AC
I
Address
Land Use
TOTAL SIZE
Lot Size
Zoning
1,115,174 SF
9.72 AC
D-4
Address
Land Use
TOTAL SIZE
Lot Size
Zoning
530,605 SF
127 AC
RP
Address
Land Use
TOTAL SIZE
Lot Size
Zoning
365,253 SF
33.64 AC
I
Address
Land Use
TOTAL SIZE
Lot Size
Zoning
352,836 SF
20.05 AC
PL
Address
Land Use
TOTAL SIZE
Lot Size
Zoning
350,000 SF
10 AC
U1
Address
Land Use
TOTAL SIZE
Lot Size
Zoning
56,741 SF
1.70 AC
D-1
Address
Land Use
TOTAL SIZE
Lot Size
Zoning
87,933 SF
4.90 AC
D-1
Address
Land Use
TOTAL SIZE
Lot Size
Zoning
185,202 SF
51.07 AC
J
Address
Land Use
TOTAL SIZE
Lot Size
Zoning
2,566,335 SF
10.01 AC
D-1
Address
Land Use
TOTAL SIZE
Lot Size
Zoning
205,570 SF
5.63 AC
UI
Address
Land Use
TOTAL SIZE
Lot Size
Zoning
1,849,748 SF
6.88 AC
D-1
Address
Land Use
TOTAL SIZE
Lot Size
Zoning
1,330,058 SF
5.02 AC
D2
Address
Land Use
TOTAL SIZE
Lot Size
Zoning
836,183 SF
5.89 AC
TSA-UC
Address
Land Use
TOTAL SIZE
Lot Size
Zoning
298,628 SF
27.30 AC
I
Address
Land Use
TOTAL SIZE
Lot Size
Zoning
807,940 SF
0.69 AC
D1
Address
Land Use
TOTAL SIZE
Lot Size
Zoning
299,535 SF
38 AC
I
Address
Land Use
TOTAL SIZE
Lot Size
Zoning
254,939 SF
34.68 AC
I
Address
Land Use
TOTAL SIZE
Lot Size
Zoning
712,539 SF
0.01 AC
D1
Address
Land Use
TOTAL SIZE
Lot Size
Zoning
1,256,042 SF
3.50 AC
D-1
Address
Land Use
TOTAL SIZE
Lot Size
Zoning
82,851 SF
9.76 AC
PL2
Address
Land Use
TOTAL SIZE
Lot Size
Zoning
588,291 SF
1.28 AC
D-1
Address
Land Use
TOTAL SIZE
Lot Size
Zoning
434,481 SF
10 AC
D-1
Address
Land Use
TOTAL SIZE
Lot Size
Zoning
497,018 SF
13.11 AC
I
Address
Land Use
TOTAL SIZE
Lot Size
Zoning
157,938 SF
12 AC
1205
Address
Land Use
TOTAL SIZE
Lot Size
Zoning
146,422 SF
2.62 AC
UI
The World's #1 Commercial Real Estate Marketplace
Connect with us
© 2026 CoStar Group
The information above has been obtained from sources believed reliable. While we do not doubt its accuracy we have not verified it and make no guarantee, warranty or representation about it. It is your responsibility to independently confirm its accuracy and completeness. Any projections, opinions, assumptions, or estimates used are for example only and do not represent the current or future performance of the property. The value of this transaction to you depends on tax and other factors which should be evaluated by your tax, financial, and legal advisors. You and your advisors should conduct a careful, independent investigation of the property to determine to your satisfaction the suitability of the property for your needs.