Property Record
278 E 100 S, Salt Lake City, UT 84111


This Property Is For Sale
NEARBY LISTINGS FOR SALE OR LEASE
Property Detail
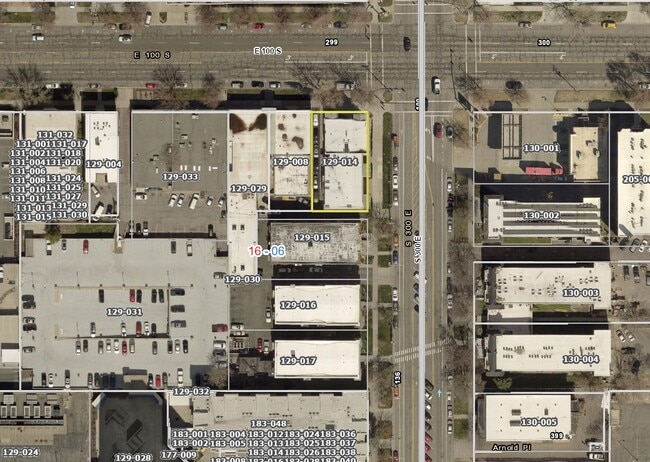
278 E 100 S
Salt Lake City, UT
Plat A
16-06-129-014-0000
BEG AT NE COR LOT 8, BLK 72, PLAT A, SLC SUR; S 117 FT; W 66FT; N 117 FT; E 66 FT TO BEG. 4472-529 THRU 532 4472-0533, 5401-350 5401-0352 5648-0185 5847-2004 5890-2523 5890-2525 6212-1298 6267-2546 6597-1319 6831-0375 9947-3693 10135-974110299-7814 1
Governmentalpublicusegeneral
Salt Lake
X
Utah
49035C0144H
8
2024
0.18 AC
2025
Central Salt Lake City
102100
Salt Lake City
4,838 SF
DEMOGRAPHICS near 278 E 100 S
1 Mile
3 Mile
5 Mile
2024 Total Population
34,737
140,753
236,731
2029 Population
36,150
143,477
240,949
Pop Growth 2024-2029
+ 4.07%
+ 1.94%
+ 1.78%
Average Age
38
37
37
2024 Total Households
19,999
64,044
100,861
HH Growth 2024-2029
+ 4.48%
+ 2.44%
+ 2.14%
Median Household Inc
$54,373
$59,983
$64,960
Avg Household Size
1.60
2.00
2.20
2024 Avg HH Vehicles
1.00
1.00
2.00
Median Home Value
$499,422
$481,707
$483,543
Median Year Built
1977
1965
1968
Nearby Places
Map Layers
Map Styles
 Street
 Aerial
- Restaurants
- Banks
- Shops
- Fitness
- Groceries
PUBLIC TRANSPORTATION
TRANSIT/SUBWAY
City Center (TRAX Salt Lake/Sandy Line - Utah Transit Authority (UTA), TRAX University Line - Utah Transit Authority (UTA))
DRIVE
WALK
Distance
City Center (TRAX Salt Lake/Sandy Line - Utah Transit Authority (UTA), TRAX University Line - Utah Transit Authority (UTA))
3 min
10 min
0.5 mi
Main Library (TRAX Murray/Midvale/University Line - Utah Transit Authority (UTA), TRAX University Line - Utah Transit Authority (UTA))
DRIVE
WALK
Distance
Main Library (TRAX Murray/Midvale/University Line - Utah Transit Authority (UTA), TRAX University Line - Utah Transit Authority (UTA))
2 min
11 min
0.6 mi
Gallivan Plaza (TRAX Salt Lake/Sandy Line - Utah Transit Authority (UTA), TRAX University Line - Utah Transit Authority (UTA))
DRIVE
WALK
Distance
Gallivan Plaza (TRAX Salt Lake/Sandy Line - Utah Transit Authority (UTA), TRAX University Line - Utah Transit Authority (UTA))
2 min
13 min
0.7 mi
Temple Square (TRAX Salt Lake/Sandy Line - Utah Transit Authority (UTA), TRAX University Line - Utah Transit Authority (UTA))
DRIVE
WALK
Distance
Temple Square (TRAX Salt Lake/Sandy Line - Utah Transit Authority (UTA), TRAX University Line - Utah Transit Authority (UTA))
4 min
16 min
0.8 mi
Trolley Square (TRAX Murray/Midvale/University Line - Utah Transit Authority (UTA), TRAX University Line - Utah Transit Authority (UTA))
DRIVE
WALK
Distance
Trolley Square (TRAX Murray/Midvale/University Line - Utah Transit Authority (UTA), TRAX University Line - Utah Transit Authority (UTA))
3 min
18 min
0.9 mi
COMMUTER RAIL
DRIVE
WALK
Distance
6 min
1.8 mi
DRIVE
WALK
Distance
9 min
3.2 mi
AIRPORT
Salt Lake City International
DRIVE
WALK
Distance
Salt Lake City International
14 min
7.6 mi
Nearby Properties
Address
Land Use
TOTAL SIZE
Lot Size
Zoning
Address
Land Use
TOTAL SIZE
Lot Size
Zoning
2,287,331 SF
137 AC
I
Address
Land Use
TOTAL SIZE
Lot Size
Zoning
1,260,285 SF
59.07 AC
I
Address
Land Use
TOTAL SIZE
Lot Size
Zoning
591,924 SF
80.77 AC
I
Address
Land Use
TOTAL SIZE
Lot Size
Zoning
298,342 SF
13.71 AC
I
Address
Land Use
TOTAL SIZE
Lot Size
Zoning
1,262,865 SF
44.15 AC
I
Address
Land Use
TOTAL SIZE
Lot Size
Zoning
1,115,174 SF
9.72 AC
D-4
Address
Land Use
TOTAL SIZE
Lot Size
Zoning
530,605 SF
127 AC
RP
Address
Land Use
TOTAL SIZE
Lot Size
Zoning
365,253 SF
33.64 AC
I
Address
Land Use
TOTAL SIZE
Lot Size
Zoning
352,836 SF
20.05 AC
PL
Address
Land Use
TOTAL SIZE
Lot Size
Zoning
350,000 SF
10 AC
U1
Address
Land Use
TOTAL SIZE
Lot Size
Zoning
56,741 SF
1.70 AC
D-1
Address
Land Use
TOTAL SIZE
Lot Size
Zoning
87,933 SF
4.90 AC
D-1
Address
Land Use
TOTAL SIZE
Lot Size
Zoning
185,202 SF
51.07 AC
J
Address
Land Use
TOTAL SIZE
Lot Size
Zoning
2,566,335 SF
10.01 AC
D-1
Address
Land Use
TOTAL SIZE
Lot Size
Zoning
205,570 SF
5.63 AC
UI
Address
Land Use
TOTAL SIZE
Lot Size
Zoning
1,849,748 SF
6.88 AC
D-1
Address
Land Use
TOTAL SIZE
Lot Size
Zoning
1,330,058 SF
5.02 AC
D2
Address
Land Use
TOTAL SIZE
Lot Size
Zoning
836,183 SF
5.89 AC
TSA-UC
Address
Land Use
TOTAL SIZE
Lot Size
Zoning
298,628 SF
27.30 AC
I
Address
Land Use
TOTAL SIZE
Lot Size
Zoning
807,940 SF
0.69 AC
D1
Address
Land Use
TOTAL SIZE
Lot Size
Zoning
299,535 SF
38 AC
I
Address
Land Use
TOTAL SIZE
Lot Size
Zoning
254,939 SF
34.68 AC
I
Address
Land Use
TOTAL SIZE
Lot Size
Zoning
712,539 SF
0.01 AC
D1
Address
Land Use
TOTAL SIZE
Lot Size
Zoning
1,256,042 SF
3.50 AC
D-1
Address
Land Use
TOTAL SIZE
Lot Size
Zoning
82,851 SF
9.76 AC
PL2
Address
Land Use
TOTAL SIZE
Lot Size
Zoning
588,291 SF
1.28 AC
D-1
Address
Land Use
TOTAL SIZE
Lot Size
Zoning
434,481 SF
10 AC
D-1
Address
Land Use
TOTAL SIZE
Lot Size
Zoning
497,018 SF
13.11 AC
I
Address
Land Use
TOTAL SIZE
Lot Size
Zoning
157,938 SF
12 AC
1205
Address
Land Use
TOTAL SIZE
Lot Size
Zoning
146,422 SF
2.62 AC
UI
The World's #1 Commercial Real Estate Marketplace
Connect with us
© 2026 CoStar Group
The information above has been obtained from sources believed reliable. While we do not doubt its accuracy we have not verified it and make no guarantee, warranty or representation about it. It is your responsibility to independently confirm its accuracy and completeness. Any projections, opinions, assumptions, or estimates used are for example only and do not represent the current or future performance of the property. The value of this transaction to you depends on tax and other factors which should be evaluated by your tax, financial, and legal advisors. You and your advisors should conduct a careful, independent investigation of the property to determine to your satisfaction the suitability of the property for your needs.