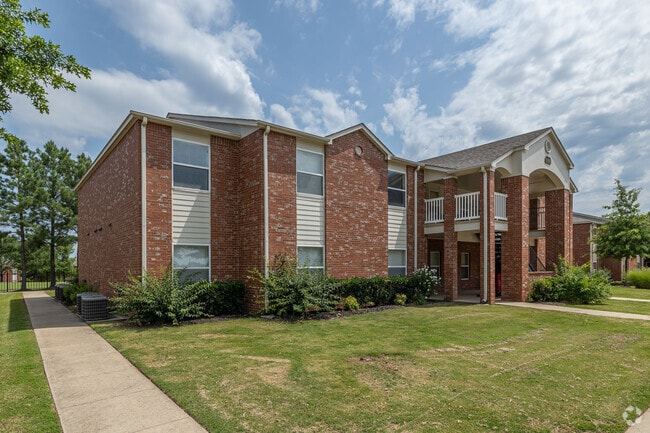
Property Record
2903 Sw Bright Rd, Bentonville, AR 72713
NEARBY LISTINGS FOR SALE OR LEASE
-
-
View all Bentonville listings for sale on LoopNet.com
Property Detail
2903 Sw Bright Rd
Fayetteville-Springdale-Rogers, AR-MO
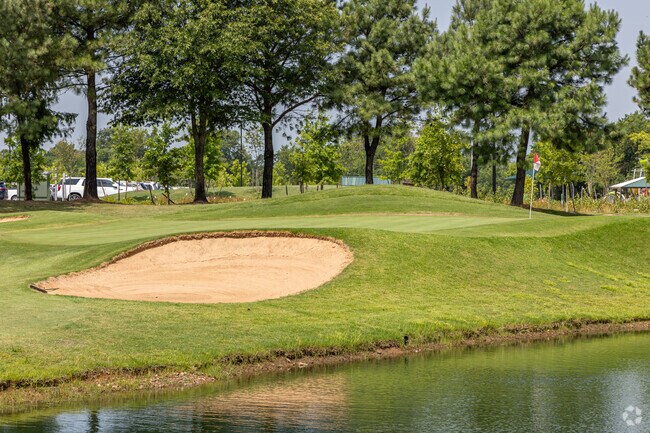
Links At Rainbow Curve Sub, The-Bentonvi
01-16667-000
PLAT 9/6/2011 2011 393-396 LESS AND EXCEPT: PART OF LOT 4, THE LINKS AT RAINBOW CURVE SUBDIVISION, CITY OF BENTONVILLE, ALSO BEING A PART OF THE NORTHEAST QUARTER OF THE NORTHWEST QUARTER OF SECTION 12, TOWNSHIP 19 NORTH, RANGE 31 WEST, BENTON COUNTY
Apartment
Benton
X
Arkansas
05007C0255K
4
2025
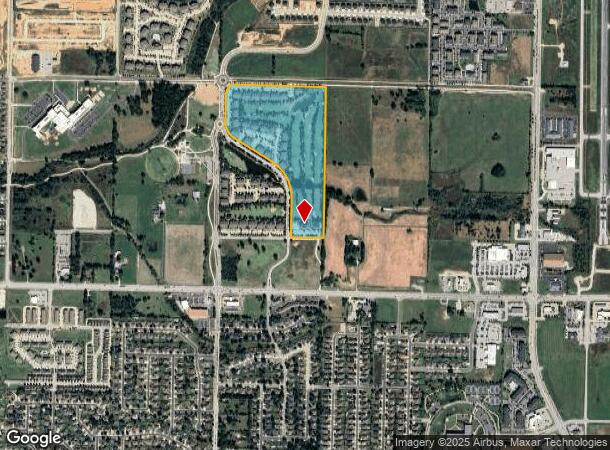
35.35 AC
2025
Outer Central Benton County
020607
Fayetteville/Springdale/Rogers
458,697 SF
DEMOGRAPHICS near 2903 Sw Bright Rd
1 Mile
3 Mile
5 Mile
2024 Total Population
11,218
53,121
116,564
2029 Population
13,202
62,903
137,966
Pop Growth 2024-2029
+ 17.69%
+ 18.41%
+ 18.36%
Average Age
32
34
35
2024 Total Households
4,107
20,303
43,191
HH Growth 2024-2029
+ 17.46%
+ 18.53%
+ 18.46%
Median Household Inc
$100,609
$90,725
$92,499
Avg Household Size
2.70
2.60
2.60
2024 Avg HH Vehicles
2.00
2.00
2.00
Median Home Value
$310,781
$295,314
$293,775
Median Year Built
2010
2006
2004
Nearby Places
Map Layers
Map Styles
 Street
 Aerial
- Restaurants
- Banks
- Shops
- Fitness
- Groceries
PUBLIC TRANSPORTATION
AIRPORT
Northwest Arkansas Ntl
DRIVE
WALK
Distance
Northwest Arkansas Ntl
20 min
8.6 mi
Freight Ports
Tulsa Port of Inola
DRIVE
WALK
Distance
Tulsa Port of Inola
116 min
99.3 mi
Nearby Properties
Address
Land Use
TOTAL SIZE
Lot Size
Zoning
Address
Land Use
TOTAL SIZE
Lot Size
Zoning
147,199 SF
16.11 AC
Address
Land Use
TOTAL SIZE
Lot Size
Zoning
344,315 SF
12.74 AC
Address
Land Use
TOTAL SIZE
Lot Size
Zoning
18,622 SF
104.67 AC
Address
Land Use
TOTAL SIZE
Lot Size
Zoning
516,588 SF
24.53 AC
Address
Land Use
TOTAL SIZE
Lot Size
Zoning
216,538 SF
22.14 AC
Address
Land Use
TOTAL SIZE
Lot Size
Zoning
149,727 SF
1.32 AC
Address
Land Use
TOTAL SIZE
Lot Size
Zoning
1,159,141 SF
176.54 AC
Address
Land Use
TOTAL SIZE
Lot Size
Zoning
381,924 SF
10.23 AC
Address
Land Use
TOTAL SIZE
Lot Size
Zoning
546,195 SF
15.80 AC
Address
Land Use
TOTAL SIZE
Lot Size
Zoning
187,529 SF
37.78 AC
Address
Land Use
TOTAL SIZE
Lot Size
Zoning
254,163 SF
10.98 AC
Address
Land Use
TOTAL SIZE
Lot Size
Zoning
573,822 SF
10.56 AC
Address
Land Use
TOTAL SIZE
Lot Size
Zoning
375,605 SF
24.54 AC
Address
Land Use
TOTAL SIZE
Lot Size
Zoning
247,292 SF
1.57 AC
Address
Land Use
TOTAL SIZE
Lot Size
Zoning
234,432 SF
19.98 AC
Address
Land Use
TOTAL SIZE
Lot Size
Zoning
208,865 SF
7.73 AC
Address
Land Use
TOTAL SIZE
Lot Size
Zoning
42,848 SF
3.08 AC
Address
Land Use
TOTAL SIZE
Lot Size
Zoning
270,199 SF
10.23 AC
Address
Land Use
TOTAL SIZE
Lot Size
Zoning
283,760 SF
11.61 AC
Address
Land Use
TOTAL SIZE
Lot Size
Zoning
256,469 SF
3.18 AC
Address
Land Use
TOTAL SIZE
Lot Size
Zoning
218,437 SF
17.90 AC
Address
Land Use
TOTAL SIZE
Lot Size
Zoning
171,746 SF
9.32 AC
Address
Land Use
TOTAL SIZE
Lot Size
Zoning
39,047 SF
1.43 AC
Address
Land Use
TOTAL SIZE
Lot Size
Zoning
264,824 SF
17.24 AC
Address
Land Use
TOTAL SIZE
Lot Size
Zoning
207,431 SF
14.19 AC
Address
Land Use
TOTAL SIZE
Lot Size
Zoning
152,925 SF
16.49 AC
Address
Land Use
TOTAL SIZE
Lot Size
Zoning
148,292 SF
4.32 AC
Address
Land Use
TOTAL SIZE
Lot Size
Zoning
64,098 SF
2.17 AC
The World's #1 Commercial Real Estate Marketplace
Connect with us
© 2026 CoStar Group
The information above has been obtained from sources believed reliable. While we do not doubt its accuracy we have not verified it and make no guarantee, warranty or representation about it. It is your responsibility to independently confirm its accuracy and completeness. Any projections, opinions, assumptions, or estimates used are for example only and do not represent the current or future performance of the property. The value of this transaction to you depends on tax and other factors which should be evaluated by your tax, financial, and legal advisors. You and your advisors should conduct a careful, independent investigation of the property to determine to your satisfaction the suitability of the property for your needs.