Property Record
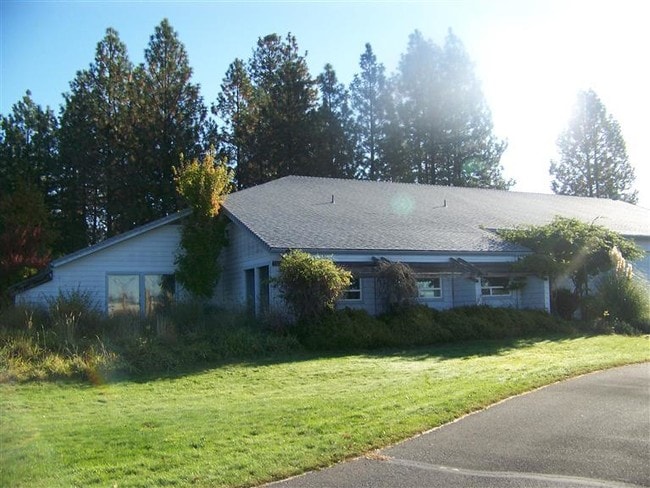
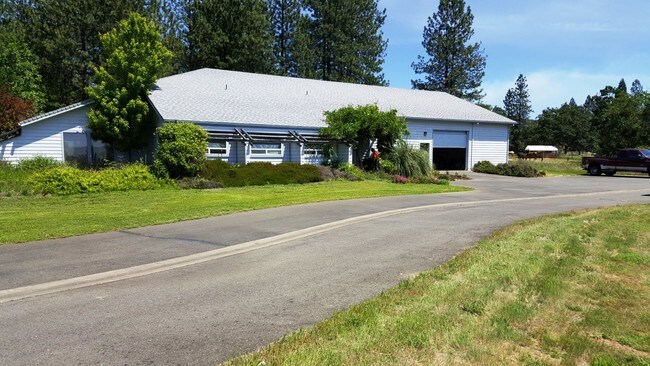
301 N Valley Dr, Grants Pass, OR 97526

Property Detail
301 N Valley Dr
R333325
NORTH VALLEY IND. PARK, LOT 10, ACRES 3.17
Industrialgeneral
Josephine
CLI
Oregon
B and X Area of moderate flood hazard, usually the area between the limits of the 100-year and 500-year floods.
10
2024
3.17 AC
2025
Other Market Areas
360300
Grants Pass, OR
3,294 SF
NEARBY LISTINGS FOR SALE OR LEASE
DEMOGRAPHICS near 301 N Valley Dr
1 mile
3 mile
5 mile
2024 Total Population
998
5,279
26,130
2029 Population
993
5,248
25,968
Pop Growth 2024-2029
(0.50%)
(0.59%)
(0.62%)
Average Age
50
49
46
2024 Total Households
403
2,064
10,642
HH Growth 2024-2029
(0.50%)
(0.63%)
(0.66%)
Median Household Inc
$50,435
$52,841
$49,413
Avg Household Size
2.40
2.40
2.40
2024 Avg HH Vehicles
2.00
2.00
2.00
Median Home Value
$459,285
$433,060
$361,460
Median Year Built
1982
1983
1977
Nearby Places
Map Layers
Map Styles
 Street
 Aerial
Transit
 Traffic
 Biking
Places
Listings with unknown addresses are not visible on the map
- Restaurants
- Banks
- Shops
- Fitness
- Groceries
PUBLIC TRANSPORTATION
AIRPORT
Rogue Valley International - Medford
Drive
Walk
Distance
Rogue Valley International - Medford
40 min
31.5 mi
SALE & LEASE HISTORY
LISTING DATE
SALE/LEASE

Sep 23, 2016
For Sale
Nearby Properties
Address
Land Use
TOTAL SIZE
Lot Size
Zoning
Address
Land Use
TOTAL SIZE
Lot Size
Zoning
280 SF
47.11 AC
WR
Address
Land Use
TOTAL SIZE
Lot Size
Zoning
80 SF
53.12 AC
CR5
Address
Land Use
TOTAL SIZE
Lot Size
Zoning
2,450 SF
10.02 AC
CLI
Address
Land Use
TOTAL SIZE
Lot Size
Zoning
2.18 AC
CLI
Address
Land Use
TOTAL SIZE
Lot Size
Zoning
57,600 SF
5 AC
CLI
Address
Land Use
TOTAL SIZE
Lot Size
Zoning
70,060 SF
10.02 AC
CLI
Address
Land Use
TOTAL SIZE
Lot Size
Zoning
10,340 SF
11.67 AC
RI
Address
Land Use
TOTAL SIZE
Lot Size
Zoning
1,080 SF
3.61 AC
CLI
Address
Land Use
TOTAL SIZE
Lot Size
Zoning
2.18 AC
CLI
Address
Land Use
TOTAL SIZE
Lot Size
Zoning
5,936 SF
7.44 AC
CLI
Address
Land Use
TOTAL SIZE
Lot Size
Zoning
17,920 SF
2.55 AC
CLI
Address
Land Use
TOTAL SIZE
Lot Size
Zoning
1,620 SF
63.68 AC
CLI
Address
Land Use
TOTAL SIZE
Lot Size
Zoning
18,454 SF
6 AC
CLI
Address
Land Use
TOTAL SIZE
Lot Size
Zoning
12.83 AC
CC
Address
Land Use
TOTAL SIZE
Lot Size
Zoning
391 SF
7.26 AC
CR2
Address
Land Use
TOTAL SIZE
Lot Size
Zoning
7,536 SF
2.22 AC
CI
Address
Land Use
TOTAL SIZE
Lot Size
Zoning
1,188 SF
4.30 AC
CLI
Address
Land Use
TOTAL SIZE
Lot Size
Zoning
1,680 SF
4.94 AC
RI
Address
Land Use
TOTAL SIZE
Lot Size
Zoning
5.16 AC
CC
Address
Land Use
TOTAL SIZE
Lot Size
Zoning
12,990 SF
5.03 AC
RR5
Address
Land Use
TOTAL SIZE
Lot Size
Zoning
16,380 SF
1.90 AC
CLI
Address
Land Use
TOTAL SIZE
Lot Size
Zoning
22,320 SF
2.20 AC
BP
Address
Land Use
TOTAL SIZE
Lot Size
Zoning
2,208 SF
2 AC
R-3
Address
Land Use
TOTAL SIZE
Lot Size
Zoning
2,020 SF
6.07 AC
R-3
Address
Land Use
TOTAL SIZE
Lot Size
Zoning
1,344 SF
69.65 AC
CLI
Address
Land Use
TOTAL SIZE
Lot Size
Zoning
17,920 SF
2.55 AC
CLI
Address
Land Use
TOTAL SIZE
Lot Size
Zoning
6,810 SF
5.03 AC
CLI
Address
Land Use
TOTAL SIZE
Lot Size
Zoning
2 AC
CLI
Address
Land Use
TOTAL SIZE
Lot Size
Zoning
8,278 SF
78.87 AC
WR
Address
Land Use
TOTAL SIZE
Lot Size
Zoning
3,500 SF
1.78 AC
R-1-8
The World's #1 Commercial Real Estate Marketplace
Connect with us
© 2026 CoStar Group
The information above has been obtained from sources believed reliable. While we do not doubt its accuracy we have not verified it and make no guarantee, warranty or representation about it. It is your responsibility to independently confirm its accuracy and completeness. Any projections, opinions, assumptions, or estimates used are for example only and do not represent the current or future performance of the property. The value of this transaction to you depends on tax and other factors which should be evaluated by your tax, financial, and legal advisors. You and your advisors should conduct a careful, independent investigation of the property to determine to your satisfaction the suitability of the property for your needs.