Property Record
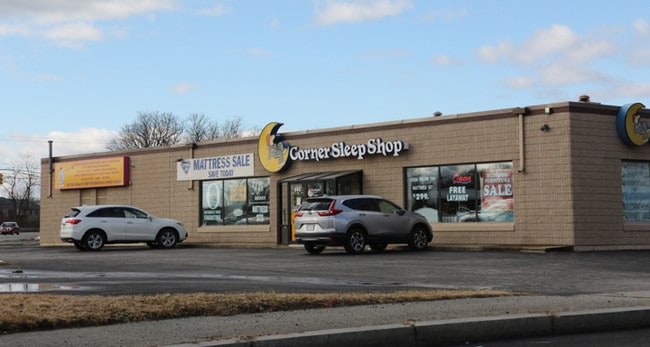
353 Mariano Bishop Blvd, Fall River, MA 02721

Property Detail
353 Mariano Bishop Blvd
FALL-000006C-000000-000030
Bristol
Vehiclerentalsvehiclesales
Massachusetts
B-N
30
B and X Area of moderate flood hazard, usually the area between the limits of the 100-year and 500-year floods.
0.50 AC
2025
Attleboro/New Bedford
2025
Boston
640100
Providence-Warwick, RI-MA
7,906 SF
NEARBY LISTINGS FOR SALE OR LEASE
DEMOGRAPHICS near 353 Mariano Bishop Blvd
1 mile
3 mile
5 mile
2025 Total Population
14,721
85,347
132,784
2030 Population
14,835
86,126
133,916
Pop Growth 2025-2030
+ 0.77%
+ 0.91%
+ 0.85%
Average Age
41
40
42
2025 Total Households
6,194
37,544
56,513
HH Growth 2025-2030
+ 0.90%
+ 1.05%
+ 1.02%
Median Household Inc
$54,319
$53,309
$65,418
Avg Household Size
2.30
2.20
2.30
2025 Avg HH Vehicles
1.00
1.00
2.00
Median Home Value
$393,091
$391,447
$413,151
Median Year Built
1949
1948
1950
Nearby Places
Map Layers
Map Styles
 Street
 Aerial
Transit
 Traffic
 Biking
Places
Listings with unknown addresses are not visible on the map
- Restaurants
- Banks
- Shops
- Fitness
- Groceries
PUBLIC TRANSPORTATION
AIRPORT
Rhode Island Tf Green International
Drive
Walk
Distance
Rhode Island Tf Green International
40 min
26.0 mi
SALE & LEASE HISTORY
LISTING DATE
SALE/LEASE

Nov 05, 2020
For Lease
Feb 12, 2018
For Sale
Nearby Properties
Address
Land Use
TOTAL SIZE
Lot Size
Zoning
Address
Land Use
TOTAL SIZE
Lot Size
Zoning
11.26 AC
IND
Address
Land Use
TOTAL SIZE
Lot Size
Zoning
27.66 AC
I
Address
Land Use
TOTAL SIZE
Lot Size
Zoning
73,957 SF
46.62 AC
CO
Address
Land Use
TOTAL SIZE
Lot Size
Zoning
183,732 SF
5.50 AC
IND
Address
Land Use
TOTAL SIZE
Lot Size
Zoning
14.30 AC
G
Address
Land Use
TOTAL SIZE
Lot Size
Zoning
212,639 SF
22.75 AC
S
Address
Land Use
TOTAL SIZE
Lot Size
Zoning
6.16 AC
B-L
Address
Land Use
TOTAL SIZE
Lot Size
Zoning
118,979 SF
6.65 AC
M
Address
Land Use
TOTAL SIZE
Lot Size
Zoning
140,946 SF
8.24 AC
S
Address
Land Use
TOTAL SIZE
Lot Size
Zoning
132,666 SF
18.97 AC
IND
Address
Land Use
TOTAL SIZE
Lot Size
Zoning
16.08 AC
N/A
Address
Land Use
TOTAL SIZE
Lot Size
Zoning
107,441 SF
2.10 AC
N/A
Address
Land Use
TOTAL SIZE
Lot Size
Zoning
113,643 SF
4.95 AC
R-4
Address
Land Use
TOTAL SIZE
Lot Size
Zoning
559.70 AC
S
Address
Land Use
TOTAL SIZE
Lot Size
Zoning
116,036 SF
2.43 AC
R-4
Address
Land Use
TOTAL SIZE
Lot Size
Zoning
78,883 SF
40.99 AC
N/A
Address
Land Use
TOTAL SIZE
Lot Size
Zoning
150,156 SF
8.77 AC
R40
Address
Land Use
TOTAL SIZE
Lot Size
Zoning
126,146 SF
1.18 AC
A-2
Address
Land Use
TOTAL SIZE
Lot Size
Zoning
3,016 SF
16.79 AC
M
Address
Land Use
TOTAL SIZE
Lot Size
Zoning
9.44 AC
A-2
Address
Land Use
TOTAL SIZE
Lot Size
Zoning
177,051 SF
3.13 AC
CBD
Address
Land Use
TOTAL SIZE
Lot Size
Zoning
194,181 SF
3.40 AC
Address
Land Use
TOTAL SIZE
Lot Size
Zoning
178,538 SF
17.27 AC
I
Address
Land Use
TOTAL SIZE
Lot Size
Zoning
160,234 SF
2.98 AC
CBD
Address
Land Use
TOTAL SIZE
Lot Size
Zoning
11.17 AC
MBD
Address
Land Use
TOTAL SIZE
Lot Size
Zoning
153,134 SF
14.57 AC
IND
Address
Land Use
TOTAL SIZE
Lot Size
Zoning
75,736 SF
1.39 AC
B-L
Address
Land Use
TOTAL SIZE
Lot Size
Zoning
22.36 AC
B-N
Address
Land Use
TOTAL SIZE
Lot Size
Zoning
131,086 SF
2.29 AC
CBD
Address
Land Use
TOTAL SIZE
Lot Size
Zoning
142,842 SF
2.45 AC
IND
The World's #1 Commercial Real Estate Marketplace
Connect with us
© 2026 CoStar Group
The information above has been obtained from sources believed reliable. While we do not doubt its accuracy we have not verified it and make no guarantee, warranty or representation about it. It is your responsibility to independently confirm its accuracy and completeness. Any projections, opinions, assumptions, or estimates used are for example only and do not represent the current or future performance of the property. The value of this transaction to you depends on tax and other factors which should be evaluated by your tax, financial, and legal advisors. You and your advisors should conduct a careful, independent investigation of the property to determine to your satisfaction the suitability of the property for your needs.