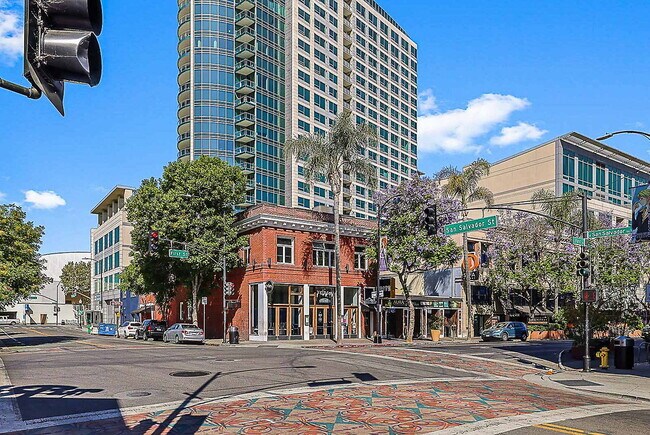
Property Record
360 S Market St, San Jose, CA 95113

Current Lease Availabilities
NEARBY LISTINGS FOR SALE OR LEASE
Property Detail
360 S Market St
Multifamilydwelling
Santa Clara
D
California
06085C0234H
1.01 AC
2024
South Market
2025
South Bay/San Jose
500800
San Jose-Sunnyvale-Santa Clara, CA
281,405 SF
264-71-220
DEMOGRAPHICS near 360 S Market St
1 Mile
3 Mile
5 Mile
2024 Total Population
46,524
254,623
650,020
2029 Population
45,583
245,694
624,825
Pop Growth 2024-2029
(2.02%)
(3.51%)
(3.88%)
Average Age
35
38
39
2024 Total Households
17,101
86,897
212,243
HH Growth 2024-2029
(1.77%)
(3.55%)
(3.96%)
Median Household Inc
$86,726
$99,063
$112,547
Avg Household Size
2.30
2.70
2.90
2024 Avg HH Vehicles
2.00
2.00
2.00
Median Home Value
$959,602
$995,186
$1,017,275
Median Year Built
1978
1974
1973
Nearby Places
Map Layers
Map Styles
 Street
 Aerial
- Restaurants
- Banks
- Shops
- Fitness
- Groceries
PUBLIC TRANSPORTATION
TRANSIT/SUBWAY
Convention Center Station (Alum Rock - Santa Teresa Line - Santa Clara VTA Light Rail, Mountain View - Winchester Line - Santa Clara VTA Light Rail)
DRIVE
WALK
Distance
Convention Center Station (Alum Rock - Santa Teresa Line - Santa Clara VTA Light Rail, Mountain View - Winchester Line - Santa Clara VTA Light Rail)
1 min
5 min
0.2 mi
Paseo de San Antonio Station northbound (Alum Rock - Santa Teresa Line - Santa Clara VTA Light Rail, Mountain View - Winchester Line - Santa Clara VTA Light Rail)
DRIVE
WALK
Distance
Paseo de San Antonio Station northbound (Alum Rock - Santa Teresa Line - Santa Clara VTA Light Rail, Mountain View - Winchester Line - Santa Clara VTA Light Rail)
1 min
5 min
0.3 mi
Paseo de San Antonio Station southbound (Alum Rock - Santa Teresa Line - Santa Clara VTA Light Rail, Mountain View - Winchester Line - Santa Clara VTA Light Rail)
DRIVE
WALK
Distance
Paseo de San Antonio Station southbound (Alum Rock - Santa Teresa Line - Santa Clara VTA Light Rail, Mountain View - Winchester Line - Santa Clara VTA Light Rail)
2 min
7 min
0.4 mi
Santa Clara Station northbound (Alum Rock - Santa Teresa Line - Santa Clara VTA Light Rail, Mountain View - Winchester Line - Santa Clara VTA Light Rail)
DRIVE
WALK
Distance
Santa Clara Station northbound (Alum Rock - Santa Teresa Line - Santa Clara VTA Light Rail, Mountain View - Winchester Line - Santa Clara VTA Light Rail)
1 min
9 min
0.5 mi
Children's Discovery Museum Station (Alum Rock - Santa Teresa Line - Santa Clara VTA Light Rail)
DRIVE
WALK
Distance
Children's Discovery Museum Station (Alum Rock - Santa Teresa Line - Santa Clara VTA Light Rail)
2 min
10 min
0.5 mi
COMMUTER RAIL
DRIVE
WALK
Distance
3 min
1.1 mi
San Jose Diridon (Caltrain - Caltrain (Caltrain))
DRIVE
WALK
Distance
San Jose Diridon (Caltrain - Caltrain (Caltrain))
3 min
1.1 mi
AIRPORT
Norman Y Mineta San Jose International
DRIVE
WALK
Distance
Norman Y Mineta San Jose International
8 min
3.7 mi
Metro Oakland International
DRIVE
WALK
Distance
Metro Oakland International
47 min
36.3 mi
San Francisco International
DRIVE
WALK
Distance
San Francisco International
45 min
36.4 mi
Freight Ports
Port of Redwood City
DRIVE
WALK
Distance
Port of Redwood City
30 min
23.3 mi
Nearby Properties
Address
Land Use
TOTAL SIZE
Lot Size
Zoning
Address
Land Use
TOTAL SIZE
Lot Size
Zoning
2.50 AC
DC
Address
Land Use
TOTAL SIZE
Lot Size
Zoning
194,790 SF
5.30 AC
APDCI
Address
Land Use
TOTAL SIZE
Lot Size
Zoning
1.73 AC
DC
Address
Land Use
TOTAL SIZE
Lot Size
Zoning
837,391 SF
1.42 AC
DC
Address
Land Use
TOTAL SIZE
Lot Size
Zoning
194,530 SF
12.26 AC
APD
Address
Land Use
TOTAL SIZE
Lot Size
Zoning
557,448 SF
1.46 AC
DC
Address
Land Use
TOTAL SIZE
Lot Size
Zoning
333,472 SF
1.24 AC
APD
Address
Land Use
TOTAL SIZE
Lot Size
Zoning
289,503 SF
0.97 AC
DC
Address
Land Use
TOTAL SIZE
Lot Size
Zoning
330,927 SF
2.35 AC
M1
Address
Land Use
TOTAL SIZE
Lot Size
Zoning
445,687 SF
6.44 AC
A(PD)
Address
Land Use
TOTAL SIZE
Lot Size
Zoning
340,000 SF
0.65 AC
CG(PD
Address
Land Use
TOTAL SIZE
Lot Size
Zoning
194,549 SF
2.76 AC
APDCI
Address
Land Use
TOTAL SIZE
Lot Size
Zoning
381,000 SF
1.40 AC
DC
Address
Land Use
TOTAL SIZE
Lot Size
Zoning
11.96 AC
M4
Address
Land Use
TOTAL SIZE
Lot Size
Zoning
491,622 SF
4.18 AC
A(PD)
Address
Land Use
TOTAL SIZE
Lot Size
Zoning
286,350 SF
0.80 AC
C
Address
Land Use
TOTAL SIZE
Lot Size
Zoning
1.16 AC
R1BD
Address
Land Use
TOTAL SIZE
Lot Size
Zoning
3.74 AC
APD
Address
Land Use
TOTAL SIZE
Lot Size
Zoning
279,230 SF
1.69 AC
C3H
Address
Land Use
TOTAL SIZE
Lot Size
Zoning
226,000 SF
0.82 AC
DC
Address
Land Use
TOTAL SIZE
Lot Size
Zoning
348,754 SF
1.58 AC
DC
Address
Land Use
TOTAL SIZE
Lot Size
Zoning
300,000 SF
1.66 AC
DC
Address
Land Use
TOTAL SIZE
Lot Size
Zoning
315,000 SF
0.71 AC
CG
Address
Land Use
TOTAL SIZE
Lot Size
Zoning
469,773 SF
7.02 AC
APD
Address
Land Use
TOTAL SIZE
Lot Size
Zoning
320,986 SF
0.78 AC
CG-PD
Address
Land Use
TOTAL SIZE
Lot Size
Zoning
350,000 SF
2.09 AC
CG
Address
Land Use
TOTAL SIZE
Lot Size
Zoning
166,696 SF
2.68 AC
APDCI
Address
Land Use
TOTAL SIZE
Lot Size
Zoning
302,148 SF
4.43 AC
APD
Address
Land Use
TOTAL SIZE
Lot Size
Zoning
367,087 SF
0.95 AC
DC
Address
Land Use
TOTAL SIZE
Lot Size
Zoning
2.41 AC
APD
The World's #1 Commercial Real Estate Marketplace
Connect with us
© 2025 CoStar Group
The information above has been obtained from sources believed reliable. While we do not doubt its accuracy we have not verified it and make no guarantee, warranty or representation about it. It is your responsibility to independently confirm its accuracy and completeness. Any projections, opinions, assumptions, or estimates used are for example only and do not represent the current or future performance of the property. The value of this transaction to you depends on tax and other factors which should be evaluated by your tax, financial, and legal advisors. You and your advisors should conduct a careful, independent investigation of the property to determine to your satisfaction the suitability of the property for your needs.