Property Record
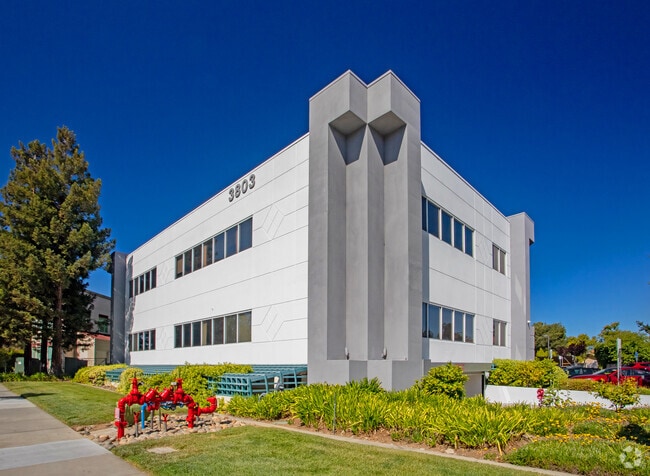
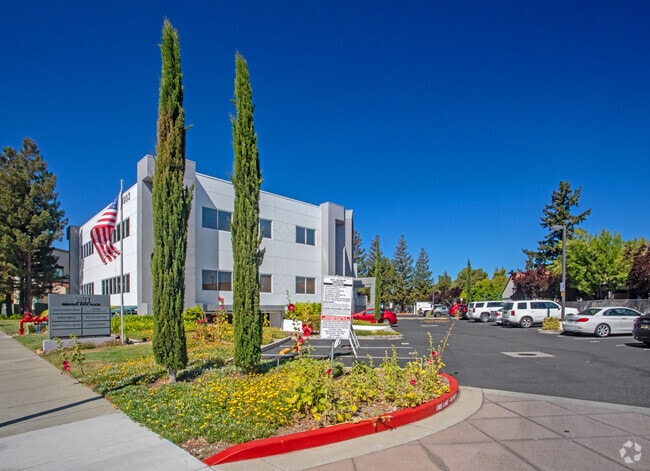
3803 S Bascom Ave, Campbell, CA 95008


Current Lease Availabilities
Property Detail
3803 S Bascom Ave
Financialbuilding
Santa Clara
P-O
California
D Areas with possible but undetermined flood hazards.
1.23 AC
2024
South San Jose
2025
South Bay/San Jose
502703
San Jose-Sunnyvale-Santa Clara, CA
32,332 SF
414-44-031
NEARBY LISTINGS FOR SALE OR LEASE
DEMOGRAPHICS near 3803 S Bascom Ave
1 mile
3 mile
5 mile
2025 Total Population
18,596
175,229
424,068
2030 Population
19,038
178,640
433,282
Pop Growth 2025-2030
+ 2.38%
+ 1.95%
+ 2.17%
Average Age
41
42
41
2025 Total Households
6,939
63,908
155,749
HH Growth 2025-2030
+ 2.42%
+ 1.93%
+ 2.18%
Median Household Inc
$181,869
$169,327
$159,537
Avg Household Size
2.60
2.70
2.70
2025 Avg HH Vehicles
2.00
2.00
2.00
Median Home Value
$1,117,222
$1,128,627
$1,125,320
Median Year Built
1973
1967
1969
Nearby Places
Map Layers
Map Styles
 Street
 Aerial
Transit
 Traffic
 Biking
Places
Listings with unknown addresses are not visible on the map
- Restaurants
- Banks
- Shops
- Fitness
- Groceries
PUBLIC TRANSPORTATION
COMMUTER RAIL
Drive
Walk
Distance
11 min
6.3 mi
Drive
Walk
Distance
12 min
7.2 mi
AIRPORT
Norman Y Mineta San Jose International
Drive
Walk
Distance
Norman Y Mineta San Jose International
14 min
8.9 mi
San Francisco International
Drive
Walk
Distance
San Francisco International
48 min
38.3 mi
Nearby Properties
Address
Land Use
TOTAL SIZE
Lot Size
Zoning
Address
Land Use
TOTAL SIZE
Lot Size
Zoning
252,210 SF
15.85 AC
C2S
Address
Land Use
TOTAL SIZE
Lot Size
Zoning
67,435 SF
11.93 AC
C2
Address
Land Use
TOTAL SIZE
Lot Size
Zoning
13.17 AC
C1
Address
Land Use
TOTAL SIZE
Lot Size
Zoning
222,000 SF
11.56 AC
IP
Address
Land Use
TOTAL SIZE
Lot Size
Zoning
116,953 SF
8.61 AC
C-2
Address
Land Use
TOTAL SIZE
Lot Size
Zoning
172,772 SF
3.47 AC
PD
Address
Land Use
TOTAL SIZE
Lot Size
Zoning
148,429 SF
0.97 AC
CMPD
Address
Land Use
TOTAL SIZE
Lot Size
Zoning
147,459 SF
0.97 AC
CMPD
Address
Land Use
TOTAL SIZE
Lot Size
Zoning
290,688 SF
8.45 AC
APD
Address
Land Use
TOTAL SIZE
Lot Size
Zoning
209,016 SF
8.50 AC
P-D
Address
Land Use
TOTAL SIZE
Lot Size
Zoning
237,928 SF
12.58 AC
APD
Address
Land Use
TOTAL SIZE
Lot Size
Zoning
190,044 SF
3.88 AC
P-D
Address
Land Use
TOTAL SIZE
Lot Size
Zoning
112,470 SF
1 AC
CMPD
Address
Land Use
TOTAL SIZE
Lot Size
Zoning
113,500 SF
0.99 AC
ASP
Address
Land Use
TOTAL SIZE
Lot Size
Zoning
115,528 SF
5.32 AC
C1
Address
Land Use
TOTAL SIZE
Lot Size
Zoning
2.42 AC
CP
Address
Land Use
TOTAL SIZE
Lot Size
Zoning
162,265 SF
6.80 AC
O
Address
Land Use
TOTAL SIZE
Lot Size
Zoning
72,000 SF
4.46 AC
C-M
Address
Land Use
TOTAL SIZE
Lot Size
Zoning
175,685 SF
9.66 AC
IP
Address
Land Use
TOTAL SIZE
Lot Size
Zoning
8.01 AC
A(PD)
Address
Land Use
TOTAL SIZE
Lot Size
Zoning
176,000 SF
3.03 AC
P-D
Address
Land Use
TOTAL SIZE
Lot Size
Zoning
147,925 SF
3.14 AC
P-D
Address
Land Use
TOTAL SIZE
Lot Size
Zoning
148,194 SF
6.49 AC
R-3
Address
Land Use
TOTAL SIZE
Lot Size
Zoning
174 SF
R18
Address
Land Use
TOTAL SIZE
Lot Size
Zoning
175,642 SF
1.40 AC
P-D
Address
Land Use
TOTAL SIZE
Lot Size
Zoning
1.27 AC
CO
Address
Land Use
TOTAL SIZE
Lot Size
Zoning
326,796 SF
12.38 AC
P-D
Address
Land Use
TOTAL SIZE
Lot Size
Zoning
118,473 SF
4.22 AC
C-2
Address
Land Use
TOTAL SIZE
Lot Size
Zoning
150,196 SF
11.32 AC
C-2
Address
Land Use
TOTAL SIZE
Lot Size
Zoning
170,285 SF
16.76 AC
G
The World's #1 Commercial Real Estate Marketplace
Connect with us
© 2026 CoStar Group
The information above has been obtained from sources believed reliable. While we do not doubt its accuracy we have not verified it and make no guarantee, warranty or representation about it. It is your responsibility to independently confirm its accuracy and completeness. Any projections, opinions, assumptions, or estimates used are for example only and do not represent the current or future performance of the property. The value of this transaction to you depends on tax and other factors which should be evaluated by your tax, financial, and legal advisors. You and your advisors should conduct a careful, independent investigation of the property to determine to your satisfaction the suitability of the property for your needs.