Property Record
3905 A1a S, Saint Augustine, FL 32080


Property Detail
3905 A1a S
174480-0000
5 ALL GL 3 LYING E OF CREEK & ALL GL 4 LYING W OF RD A1A (EX S363.42FT IN OR 245/17) (EX DOT PRCL #102 IN ORDER OF TAKING OR1106/1517)(EX PTS IN OR1367/1340 OR1395/933 & OR1445/1002) (EX 60FT STRIP OF LAND IN OR1545/794)OR4927/683
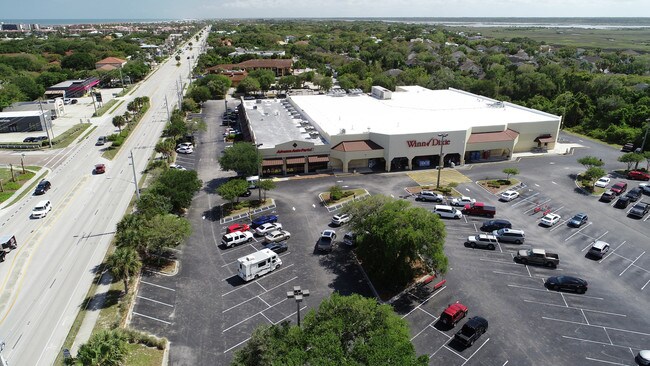
Supermarket
ST. JOHNS
CG-B
Florida
AE The base floodplain where base flood elevations are provided. AE Zones are now used on new format FIRMs instead of A1-A30 Zones.
5
2023
11.51 AC
2025
St Johns County
021408
Jacksonville (Florida)
52,011 SF
Jacksonville, FL
NEARBY LISTINGS FOR SALE OR LEASE
DEMOGRAPHICS near 3905 A1a S
1 mile
3 mile
5 mile
2025 Total Population
6,843
34,229
64,707
2030 Population
8,259
40,256
75,696
Pop Growth 2025-2030
+ 20.69%
+ 17.61%
+ 16.98%
Average Age
57
52
50
2025 Total Households
3,497
16,571
29,788
HH Growth 2025-2030
+ 21.22%
+ 18.11%
+ 17.54%
Median Household Inc
$81,194
$82,094
$80,119
Avg Household Size
2.00
2.00
2.10
2025 Avg HH Vehicles
2.00
2.00
2.00
Median Home Value
$698,596
$524,372
$488,713
Median Year Built
1988
1992
1994
Nearby Places
Map Layers
Map Styles
 Street
 Aerial
Transit
 Traffic
 Biking
Places
Listings with unknown addresses are not visible on the map
- Restaurants
- Banks
- Shops
- Fitness
- Groceries
SALE & LEASE HISTORY
LISTING DATE
SALE/LEASE

Sep 23, 2016
For Sale
May 09, 2019
For Sale
Mar 26, 2018
For Sale
Apr 04, 2017
For Sale
Nearby Properties
Address
Land Use
TOTAL SIZE
Lot Size
Zoning
Address
Land Use
TOTAL SIZE
Lot Size
Zoning
279,494 SF
6.06 AC
Address
Land Use
TOTAL SIZE
Lot Size
Zoning
127,090 SF
4.06 AC
R2
Address
Land Use
TOTAL SIZE
Lot Size
Zoning
7,133 SF
18.57 AC
RS3
Address
Land Use
TOTAL SIZE
Lot Size
Zoning
1,210 SF
3.16 AC
CG
Address
Land Use
TOTAL SIZE
Lot Size
Zoning
8,556 SF
20.32 AC
CHT
Address
Land Use
TOTAL SIZE
Lot Size
Zoning
7,021 SF
6.29 AC
OR
Address
Land Use
TOTAL SIZE
Lot Size
Zoning
85,384 SF
5.42 AC
R2
Address
Land Use
TOTAL SIZE
Lot Size
Zoning
104,688 SF
10.80 AC
Address
Land Use
TOTAL SIZE
Lot Size
Zoning
46,787 SF
3.04 AC
BU1A
Address
Land Use
TOTAL SIZE
Lot Size
Zoning
46,796 SF
1.36 AC
R2
Address
Land Use
TOTAL SIZE
Lot Size
Zoning
62,867 SF
48.30 AC
OR
Address
Land Use
TOTAL SIZE
Lot Size
Zoning
54,119 SF
2.03 AC
BU-1
Address
Land Use
TOTAL SIZE
Lot Size
Zoning
27,185 SF
206.55 AC
PUD
Address
Land Use
TOTAL SIZE
Lot Size
Zoning
76,239 SF
1.07 AC
CM1
Address
Land Use
TOTAL SIZE
Lot Size
Zoning
8,997 SF
7.13 AC
PUD
Address
Land Use
TOTAL SIZE
Lot Size
Zoning
25,453 SF
322.02 AC
OR
Address
Land Use
TOTAL SIZE
Lot Size
Zoning
2,100 SF
7.48 AC
CG
Address
Land Use
TOTAL SIZE
Lot Size
Zoning
52,176 SF
7.86 AC
Address
Land Use
TOTAL SIZE
Lot Size
Zoning
26,624 SF
2.24 AC
PUD
Address
Land Use
TOTAL SIZE
Lot Size
Zoning
20,618 SF
1.24 AC
BU-1A
Address
Land Use
TOTAL SIZE
Lot Size
Zoning
38.17 AC
OR
Address
Land Use
TOTAL SIZE
Lot Size
Zoning
96,200 SF
7.76 AC
RG-O
Address
Land Use
TOTAL SIZE
Lot Size
Zoning
2,700 SF
4.20 AC
CM1
Address
Land Use
TOTAL SIZE
Lot Size
Zoning
7,318 SF
18 AC
OR
Address
Land Use
TOTAL SIZE
Lot Size
Zoning
1.85 AC
RG2
Address
Land Use
TOTAL SIZE
Lot Size
Zoning
2,274 SF
2.07 AC
R2
Address
Land Use
TOTAL SIZE
Lot Size
Zoning
2,950 SF
7.34 AC
OR
Address
Land Use
TOTAL SIZE
Lot Size
Zoning
Address
Land Use
TOTAL SIZE
Lot Size
Zoning
21,239 SF
1.05 AC
BU-1
The World's #1 Commercial Real Estate Marketplace
Connect with us
© 2026 CoStar Group
The information above has been obtained from sources believed reliable. While we do not doubt its accuracy we have not verified it and make no guarantee, warranty or representation about it. It is your responsibility to independently confirm its accuracy and completeness. Any projections, opinions, assumptions, or estimates used are for example only and do not represent the current or future performance of the property. The value of this transaction to you depends on tax and other factors which should be evaluated by your tax, financial, and legal advisors. You and your advisors should conduct a careful, independent investigation of the property to determine to your satisfaction the suitability of the property for your needs.