Property Record
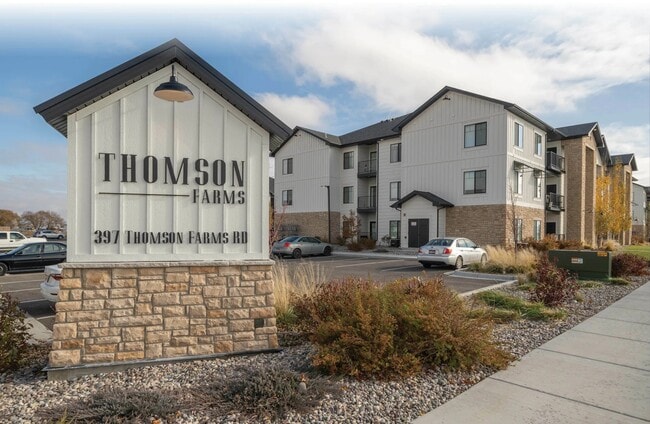
397 Thomson Farms Rd, Rexburg, ID 83440
Property Detail
397 Thomson Farms Rd
Rexburg, ID
THOMSON FARMS SUB PHASE 1 LOT 1 BLOCK 1
RPR4TF10010010
Madison
Realpropertynec
Idaho
MDR1
1
2025
4.05 AC
2025
Idaho South Area
950103
Other Market Areas
75,612 SF
NEARBY LISTINGS FOR SALE OR LEASE
DEMOGRAPHICS near 397 Thomson Farms Rd
1 mile
3 mile
5 mile
2025 Total Population
1,483
44,343
51,126
2030 Population
1,581
45,991
53,075
Pop Growth 2025-2030
+ 6.61%
+ 3.72%
+ 3.81%
Average Age
31
27
27
2025 Total Households
387
10,042
12,195
HH Growth 2025-2030
+ 7.75%
+ 4.61%
+ 4.65%
Median Household Inc
$64,119
$55,365
$56,019
Avg Household Size
2.90
2.90
2.90
2025 Avg HH Vehicles
2.00
2.00
2.00
Median Home Value
$471,874
$422,801
$430,630
Median Year Built
2010
2004
2004
Nearby Places
Map Layers
Map Styles
 Street
 Aerial
Layers
 Traffic
 Biking
Places
Listings with unknown addresses are not visible on the map
- Restaurants
- Banks
- Shops
- Fitness
- Groceries
PUBLIC TRANSPORTATION
AIRPORT
Idaho Falls Regional
Drive
Walk
Distance
Idaho Falls Regional
38 min
30.3 mi
Freight Ports
Port of Portland
Drive
Walk
Distance
Port of Portland
772 min
739.1 mi
SALE & LEASE HISTORY
LISTING DATE
SALE/LEASE

Dec 07, 2023
For Sale
Nearby Properties
Address
Land Use
TOTAL SIZE
Lot Size
Zoning
Address
Land Use
TOTAL SIZE
Lot Size
Zoning
125.56 AC
HI
Address
Land Use
TOTAL SIZE
Lot Size
Zoning
125,338 SF
5.58 AC
HDR1
Address
Land Use
TOTAL SIZE
Lot Size
Zoning
3.07 AC
CORE-T
Address
Land Use
TOTAL SIZE
Lot Size
Zoning
194,411 SF
17.15 AC
RBC
Address
Land Use
TOTAL SIZE
Lot Size
Zoning
269,479 SF
5.07 AC
HDR2
Address
Land Use
TOTAL SIZE
Lot Size
Zoning
145,966 SF
4.31 AC
HDR1
Address
Land Use
TOTAL SIZE
Lot Size
Zoning
11,211 SF
6 AC
HDR2
Address
Land Use
TOTAL SIZE
Lot Size
Zoning
5,352 SF
9.54 AC
HDR1
Address
Land Use
TOTAL SIZE
Lot Size
Zoning
74,205 SF
3.10 AC
HDR2
Address
Land Use
TOTAL SIZE
Lot Size
Zoning
1.14 AC
PRO
Address
Land Use
TOTAL SIZE
Lot Size
Zoning
1.05 AC
PRO
Address
Land Use
TOTAL SIZE
Lot Size
Zoning
46,720 SF
2.20 AC
HDR2
Address
Land Use
TOTAL SIZE
Lot Size
Zoning
126,600 SF
7.05 AC
CBC
Address
Land Use
TOTAL SIZE
Lot Size
Zoning
8,880 SF
4.12 AC
HDR2
Address
Land Use
TOTAL SIZE
Lot Size
Zoning
99,296 SF
4.56 AC
HDR1
Address
Land Use
TOTAL SIZE
Lot Size
Zoning
78,645 SF
2.77 AC
HDR1
Address
Land Use
TOTAL SIZE
Lot Size
Zoning
10 AC
SUGAR
Address
Land Use
TOTAL SIZE
Lot Size
Zoning
16,722 SF
4.97 AC
HDR1
Address
Land Use
TOTAL SIZE
Lot Size
Zoning
72,814 SF
1.60 AC
HDR2
Address
Land Use
TOTAL SIZE
Lot Size
Zoning
4,124 SF
1.19 AC
HDR2
Address
Land Use
TOTAL SIZE
Lot Size
Zoning
30.46 AC
LI
Address
Land Use
TOTAL SIZE
Lot Size
Zoning
108,924 SF
1.07 AC
CC-T
Address
Land Use
TOTAL SIZE
Lot Size
Zoning
84,823 SF
2.67 AC
MU
Address
Land Use
TOTAL SIZE
Lot Size
Zoning
77,577 SF
4.63 AC
CC-T
Address
Land Use
TOTAL SIZE
Lot Size
Zoning
4,997 SF
3.20 AC
HDR1
Address
Land Use
TOTAL SIZE
Lot Size
Zoning
8,142 SF
3.18 AC
HDR2
Address
Land Use
TOTAL SIZE
Lot Size
Zoning
83,772 SF
3.07 AC
HDR1
The World's #1 Commercial Real Estate Marketplace
Connect with us
© 2026 CoStar Group
The information above has been obtained from sources believed reliable. While we do not doubt its accuracy we have not verified it and make no guarantee, warranty or representation about it. It is your responsibility to independently confirm its accuracy and completeness. Any projections, opinions, assumptions, or estimates used are for example only and do not represent the current or future performance of the property. The value of this transaction to you depends on tax and other factors which should be evaluated by your tax, financial, and legal advisors. You and your advisors should conduct a careful, independent investigation of the property to determine to your satisfaction the suitability of the property for your needs.