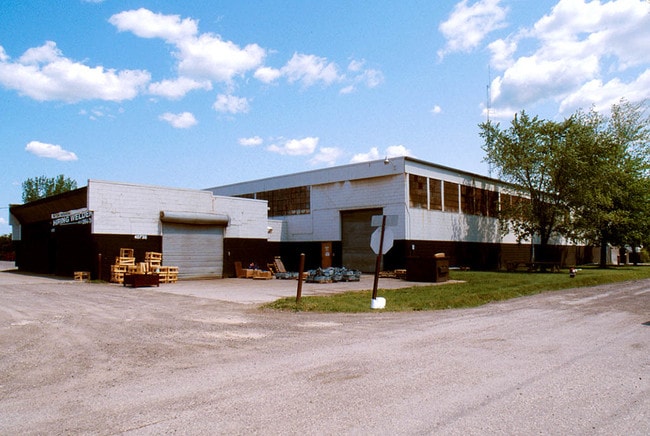
Property Record
40770 Mound Rd, Sterling Heights, MI 48310

This Property Is For Sale
Property Detail
40770 Mound Rd
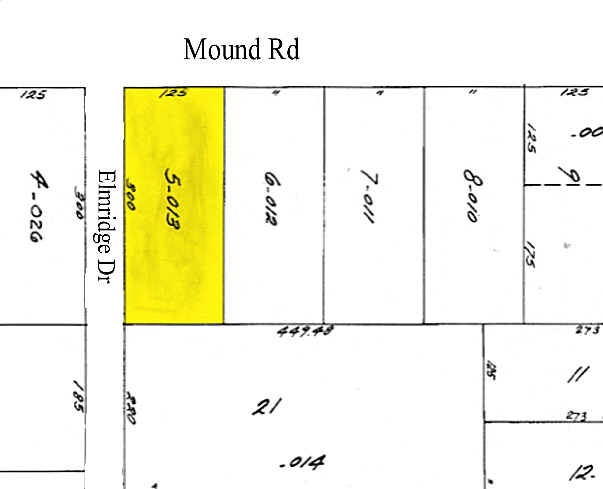
10-10-16-101-026
SUPERVISORS PLAT NO 2 (L16, P34) LOTS 5, 6, 7 & 8. COMB. FROM 10-16-101-010, -011, -012 AND -013 FOR 2006.
Officebuilding
MACOMB
M-1
Michigan
B and X Area of moderate flood hazard, usually the area between the limits of the 100-year and 500-year floods.
5-8
2025
3.44 AC
2025
W of Van Dyke/Macomb
982001
Detroit
17,174 SF
Detroit-Warren-Dearborn, MI
NEARBY LISTINGS FOR SALE OR LEASE
DEMOGRAPHICS near 40770 Mound Rd
1 mile
3 mile
5 mile
2025 Total Population
6,619
98,647
256,856
2030 Population
6,635
99,446
259,540
Pop Growth 2025-2030
+ 0.24%
+ 0.81%
+ 1.04%
Average Age
41
42
42
2025 Total Households
2,256
36,989
101,329
HH Growth 2025-2030
+ 0.31%
+ 0.85%
+ 1.12%
Median Household Inc
$70,204
$83,282
$79,831
Avg Household Size
2.90
2.60
2.50
2025 Avg HH Vehicles
2.00
2.00
2.00
Median Home Value
$259,213
$280,270
$279,951
Median Year Built
1985
1977
1977
Nearby Places
Map Layers
Map Styles
 Street
 Aerial
Transit
 Traffic
 Biking
Places
Listings with unknown addresses are not visible on the map
- Restaurants
- Banks
- Shops
- Fitness
- Groceries
PUBLIC TRANSPORTATION
AIRPORT
Windsor International
Drive
Walk
Distance
Windsor International
54 min
31.9 mi
Freight Ports
Port of Toledo
Drive
Walk
Distance
Port of Toledo
104 min
82.5 mi
Nearby Properties
Address
Land Use
TOTAL SIZE
Lot Size
Zoning
Address
Land Use
TOTAL SIZE
Lot Size
Zoning
920,611 SF
M-2
Address
Land Use
TOTAL SIZE
Lot Size
Zoning
1,024,233 SF
287.20 AC
M-2
Address
Land Use
TOTAL SIZE
Lot Size
Zoning
2,726,159 SF
199.39 AC
M-2
Address
Land Use
TOTAL SIZE
Lot Size
Zoning
40.32 AC
RM-2
Address
Land Use
TOTAL SIZE
Lot Size
Zoning
146.36 AC
MHP
Address
Land Use
TOTAL SIZE
Lot Size
Zoning
2,727,131 SF
155.26 AC
M-2
Address
Land Use
TOTAL SIZE
Lot Size
Zoning
92.30 AC
MHP
Address
Land Use
TOTAL SIZE
Lot Size
Zoning
2,058,062 SF
141.65 AC
M-2
Address
Land Use
TOTAL SIZE
Lot Size
Zoning
46.56 AC
CK MAP
Address
Land Use
TOTAL SIZE
Lot Size
Zoning
283,249 SF
M-2
Address
Land Use
TOTAL SIZE
Lot Size
Zoning
1,150 SF
25.68 AC
CK MAP
Address
Land Use
TOTAL SIZE
Lot Size
Zoning
2,984,492 SF
M-2
Address
Land Use
TOTAL SIZE
Lot Size
Zoning
423,027 SF
46.73 AC
M-1
Address
Land Use
TOTAL SIZE
Lot Size
Zoning
242,857 SF
9.61 AC
RM-3
Address
Land Use
TOTAL SIZE
Lot Size
Zoning
34.43 AC
CK MAP
Address
Land Use
TOTAL SIZE
Lot Size
Zoning
25.18 AC
RM-2
Address
Land Use
TOTAL SIZE
Lot Size
Zoning
41.09 AC
R-7
Address
Land Use
TOTAL SIZE
Lot Size
Zoning
203,282 SF
17.13 AC
C-2
Address
Land Use
TOTAL SIZE
Lot Size
Zoning
201,873 SF
M-1
Address
Land Use
TOTAL SIZE
Lot Size
Zoning
559,929 SF
41.57 AC
M-1
Address
Land Use
TOTAL SIZE
Lot Size
Zoning
255,070 SF
20.33 AC
RM-2
Address
Land Use
TOTAL SIZE
Lot Size
Zoning
29.93 AC
RM-2
Address
Land Use
TOTAL SIZE
Lot Size
Zoning
210,000 SF
M-1
Address
Land Use
TOTAL SIZE
Lot Size
Zoning
29.39 AC
CK MAP
Address
Land Use
TOTAL SIZE
Lot Size
Zoning
159,750 SF
16.76 AC
M-1
Address
Land Use
TOTAL SIZE
Lot Size
Zoning
1,350 SF
21.90 AC
CK MAP
Address
Land Use
TOTAL SIZE
Lot Size
Zoning
106,130 SF
5.37 AC
O-2
Address
Land Use
TOTAL SIZE
Lot Size
Zoning
554,374 SF
22.15 AC
M-2
Address
Land Use
TOTAL SIZE
Lot Size
Zoning
200,000 SF
17.66 AC
M-2
Address
Land Use
TOTAL SIZE
Lot Size
Zoning
21.03 AC
RM-2
The World's #1 Commercial Real Estate Marketplace
Connect with us
© 2026 CoStar Group
The information above has been obtained from sources believed reliable. While we do not doubt its accuracy we have not verified it and make no guarantee, warranty or representation about it. It is your responsibility to independently confirm its accuracy and completeness. Any projections, opinions, assumptions, or estimates used are for example only and do not represent the current or future performance of the property. The value of this transaction to you depends on tax and other factors which should be evaluated by your tax, financial, and legal advisors. You and your advisors should conduct a careful, independent investigation of the property to determine to your satisfaction the suitability of the property for your needs.