Property Record
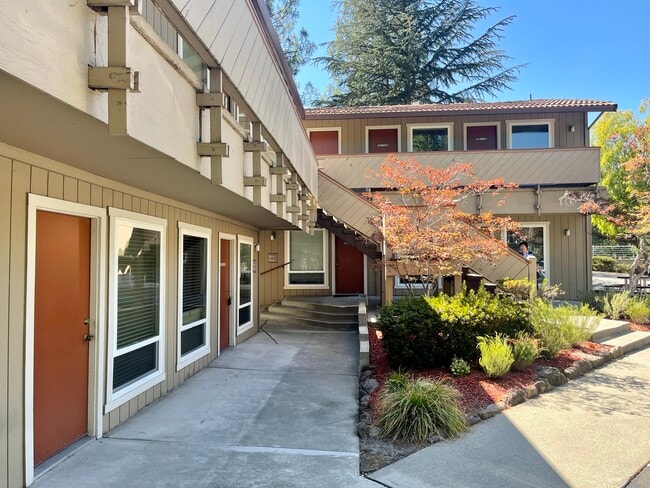
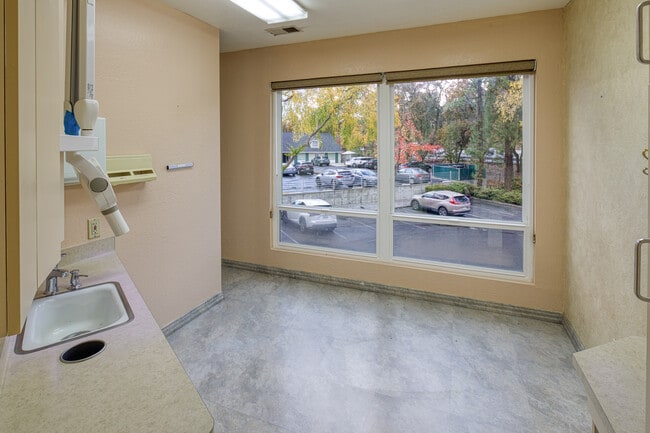
520 La Gonda Way, Danville, CA 94526


Property Detail
520 La Gonda Way
Oakland-Fremont-Berkeley, CA
RO EL RIO POR LOT 18
200-052-004-5
Contra Costa
Medicalbuilding
California
B and X Area of moderate flood hazard, usually the area between the limits of the 100-year and 500-year floods.
18
2025
0.74 AC
2025
Danville/Alamo
345203
East Bay/Oakland
7,920 SF
NEARBY LISTINGS FOR SALE OR LEASE
DEMOGRAPHICS near 520 La Gonda Way
1 mile
3 mile
5 mile
2025 Total Population
8,152
40,162
96,726
2030 Population
8,311
40,298
97,405
Pop Growth 2025-2030
+ 1.95%
+ 0.34%
+ 0.70%
Average Age
45
45
46
2025 Total Households
3,119
14,409
38,123
HH Growth 2025-2030
+ 2.08%
+ 0.41%
+ 0.81%
Median Household Inc
$206,452
$232,149
$186,606
Avg Household Size
2.60
2.80
2.50
2025 Avg HH Vehicles
2.00
2.00
2.00
Median Home Value
$1,120,106
$1,133,062
$1,100,884
Median Year Built
1974
1975
1977
Nearby Places
Map Layers
Map Styles
 Street
 Aerial
Layers
 Traffic
 Biking
Places
Listings with unknown addresses are not visible on the map
- Restaurants
- Banks
- Shops
- Fitness
- Groceries
PUBLIC TRANSPORTATION
AIRPORT
Metro Oakland International
Drive
Walk
Distance
Metro Oakland International
37 min
28.9 mi
San Francisco International
Drive
Walk
Distance
San Francisco International
57 min
38.1 mi
Norman Y Mineta San Jose International
Drive
Walk
Distance
Norman Y Mineta San Jose International
50 min
39.7 mi
Freight Ports
Port of Oakland
Drive
Walk
Distance
Port of Oakland
30 min
21.9 mi
SALE & LEASE HISTORY
LISTING DATE
SALE/LEASE

Sep 28, 2018
For Lease
Sep 19, 2018
For Lease
Sep 07, 2023
For Lease
Nov 30, 2017
For Lease
Nov 19, 2025
For Sale
Jun 21, 2018
For Lease
Jan 15, 2025
For Sale
Nearby Properties
Address
Land Use
TOTAL SIZE
Lot Size
Zoning
Address
Land Use
TOTAL SIZE
Lot Size
Zoning
157,729 SF
4.26 AC
Address
Land Use
TOTAL SIZE
Lot Size
Zoning
80,368 SF
5.89 AC
Address
Land Use
TOTAL SIZE
Lot Size
Zoning
147,509 SF
73.78 AC
A2
Address
Land Use
TOTAL SIZE
Lot Size
Zoning
2,996 SF
4.40 AC
Address
Land Use
TOTAL SIZE
Lot Size
Zoning
5,414 SF
4.73 AC
Address
Land Use
TOTAL SIZE
Lot Size
Zoning
39,831 SF
34.88 AC
R15
Address
Land Use
TOTAL SIZE
Lot Size
Zoning
67,642 SF
3.89 AC
Address
Land Use
TOTAL SIZE
Lot Size
Zoning
39,216 SF
0.92 AC
RB
Address
Land Use
TOTAL SIZE
Lot Size
Zoning
38,199 SF
9.56 AC
Address
Land Use
TOTAL SIZE
Lot Size
Zoning
78,272 SF
13.70 AC
Address
Land Use
TOTAL SIZE
Lot Size
Zoning
47,667 SF
2.78 AC
Address
Land Use
TOTAL SIZE
Lot Size
Zoning
13,390 SF
101.51 AC
P1
Address
Land Use
TOTAL SIZE
Lot Size
Zoning
6.03 AC
Address
Land Use
TOTAL SIZE
Lot Size
Zoning
51,462 SF
2 AC
Address
Land Use
TOTAL SIZE
Lot Size
Zoning
86,730 SF
4.28 AC
Address
Land Use
TOTAL SIZE
Lot Size
Zoning
46,168 SF
2.51 AC
Address
Land Use
TOTAL SIZE
Lot Size
Zoning
11,634 SF
8.70 AC
Address
Land Use
TOTAL SIZE
Lot Size
Zoning
26,608 SF
2.39 AC
Address
Land Use
TOTAL SIZE
Lot Size
Zoning
8,540 SF
1.87 AC
Address
Land Use
TOTAL SIZE
Lot Size
Zoning
38,951 SF
2.44 AC
Address
Land Use
TOTAL SIZE
Lot Size
Zoning
12,823 SF
1.85 AC
RB
Address
Land Use
TOTAL SIZE
Lot Size
Zoning
26,415 SF
0.62 AC
Address
Land Use
TOTAL SIZE
Lot Size
Zoning
16,687 SF
0.46 AC
Address
Land Use
TOTAL SIZE
Lot Size
Zoning
26,593 SF
1.19 AC
Address
Land Use
TOTAL SIZE
Lot Size
Zoning
17,640 SF
0.41 AC
RB
Address
Land Use
TOTAL SIZE
Lot Size
Zoning
12,720 SF
0.22 AC
RB
Address
Land Use
TOTAL SIZE
Lot Size
Zoning
11,969 SF
0.16 AC
RB
Address
Land Use
TOTAL SIZE
Lot Size
Zoning
12,700 SF
0.32 AC
Address
Land Use
TOTAL SIZE
Lot Size
Zoning
24,200 SF
2.96 AC
Address
Land Use
TOTAL SIZE
Lot Size
Zoning
10,049 SF
0.18 AC
RB
The World's #1 Commercial Real Estate Marketplace
Connect with us
© 2026 CoStar Group
The information above has been obtained from sources believed reliable. While we do not doubt its accuracy we have not verified it and make no guarantee, warranty or representation about it. It is your responsibility to independently confirm its accuracy and completeness. Any projections, opinions, assumptions, or estimates used are for example only and do not represent the current or future performance of the property. The value of this transaction to you depends on tax and other factors which should be evaluated by your tax, financial, and legal advisors. You and your advisors should conduct a careful, independent investigation of the property to determine to your satisfaction the suitability of the property for your needs.