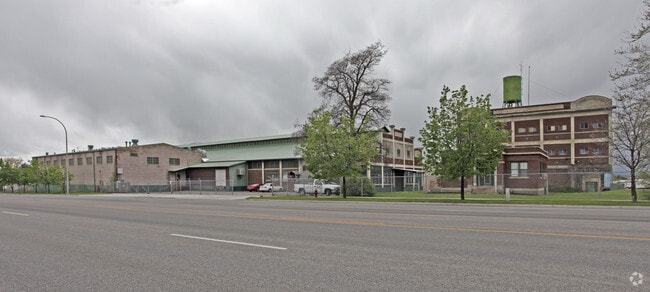
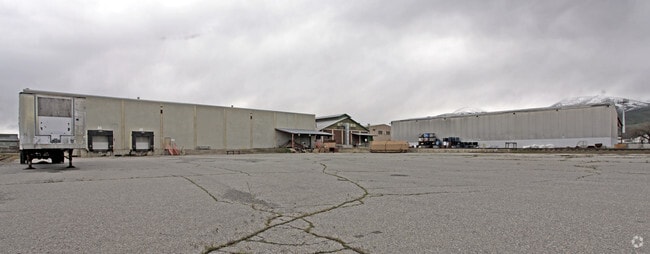
Property Record
521 S Main St, Smithfield, UT 84335

Property Detail
521 S Main St
Logan, UT-ID
BEG S 100' W 642.46 FT & E 9.76 FT FROM NE COR LT 1 BLK 4 PLT C SMITHFIELD CITY SVY & ON W LN OF ST HWY & TH N 8735'35 W 221.
08-105-0031
CACHE
Realpropertynec
Utah
B and X Area of moderate flood hazard, usually the area between the limits of the 100-year and 500-year floods.
1
2025
11.32 AC
2025
Cache County
000201
Salt Lake City
28,800 SF
NEARBY LISTINGS FOR SALE OR LEASE
DEMOGRAPHICS near 521 S Main St
1 mile
3 mile
5 mile
2025 Total Population
6,551
23,131
44,750
2030 Population
7,011
24,711
47,710
Pop Growth 2025-2030
+ 7.02%
+ 6.83%
+ 6.61%
Average Age
33
34
33
2025 Total Households
2,038
6,773
14,124
HH Growth 2025-2030
+ 7.51%
+ 7.34%
+ 7.07%
Median Household Inc
$84,307
$97,693
$87,919
Avg Household Size
3.20
3.40
3.10
2025 Avg HH Vehicles
2.00
3.00
2.00
Median Home Value
$446,758
$486,568
$489,238
Median Year Built
2002
2001
2000
Nearby Places
Map Layers
Map Styles
 Street
 Aerial
Layers
 Traffic
 Biking
Places
Listings with unknown addresses are not visible on the map
- Restaurants
- Banks
- Shops
- Fitness
- Groceries
Nearby Properties
Address
Land Use
TOTAL SIZE
Lot Size
Zoning
Address
Land Use
TOTAL SIZE
Lot Size
Zoning
9,327 SF
7.35 AC
Address
Land Use
TOTAL SIZE
Lot Size
Zoning
80,080 SF
6.36 AC
Address
Land Use
TOTAL SIZE
Lot Size
Zoning
55,500 SF
7.22 AC
Address
Land Use
TOTAL SIZE
Lot Size
Zoning
6.19 AC
Address
Land Use
TOTAL SIZE
Lot Size
Zoning
95,103 SF
4.76 AC
Address
Land Use
TOTAL SIZE
Lot Size
Zoning
73,586 SF
3.80 AC
Address
Land Use
TOTAL SIZE
Lot Size
Zoning
75,593 SF
10 AC
Address
Land Use
TOTAL SIZE
Lot Size
Zoning
77,075 SF
4.21 AC
Address
Land Use
TOTAL SIZE
Lot Size
Zoning
2,250 SF
18.79 AC
Address
Land Use
TOTAL SIZE
Lot Size
Zoning
28,287 SF
5.11 AC
Address
Land Use
TOTAL SIZE
Lot Size
Zoning
67,866 SF
4.51 AC
Address
Land Use
TOTAL SIZE
Lot Size
Zoning
66,753 SF
5.12 AC
Address
Land Use
TOTAL SIZE
Lot Size
Zoning
51,013 SF
4.42 AC
Address
Land Use
TOTAL SIZE
Lot Size
Zoning
60,454 SF
4.34 AC
Address
Land Use
TOTAL SIZE
Lot Size
Zoning
63,252 SF
3.85 AC
Address
Land Use
TOTAL SIZE
Lot Size
Zoning
63,252 SF
3.94 AC
Address
Land Use
TOTAL SIZE
Lot Size
Zoning
37,960 SF
1.53 AC
Address
Land Use
TOTAL SIZE
Lot Size
Zoning
16.09 AC
Address
Land Use
TOTAL SIZE
Lot Size
Zoning
55,494 SF
3.53 AC
Address
Land Use
TOTAL SIZE
Lot Size
Zoning
55,494 SF
3.54 AC
Address
Land Use
TOTAL SIZE
Lot Size
Zoning
86,080 SF
2.97 AC
Address
Land Use
TOTAL SIZE
Lot Size
Zoning
98,460 SF
6.69 AC
Address
Land Use
TOTAL SIZE
Lot Size
Zoning
55,120 SF
4.95 AC
Address
Land Use
TOTAL SIZE
Lot Size
Zoning
45,181 SF
3.51 AC
Address
Land Use
TOTAL SIZE
Lot Size
Zoning
54,700 SF
10 AC
Address
Land Use
TOTAL SIZE
Lot Size
Zoning
87,524 SF
5.09 AC
Address
Land Use
TOTAL SIZE
Lot Size
Zoning
52,902 SF
4.47 AC
The World's #1 Commercial Real Estate Marketplace
Connect with us
© 2026 CoStar Group
The information above has been obtained from sources believed reliable. While we do not doubt its accuracy we have not verified it and make no guarantee, warranty or representation about it. It is your responsibility to independently confirm its accuracy and completeness. Any projections, opinions, assumptions, or estimates used are for example only and do not represent the current or future performance of the property. The value of this transaction to you depends on tax and other factors which should be evaluated by your tax, financial, and legal advisors. You and your advisors should conduct a careful, independent investigation of the property to determine to your satisfaction the suitability of the property for your needs.