Property Record
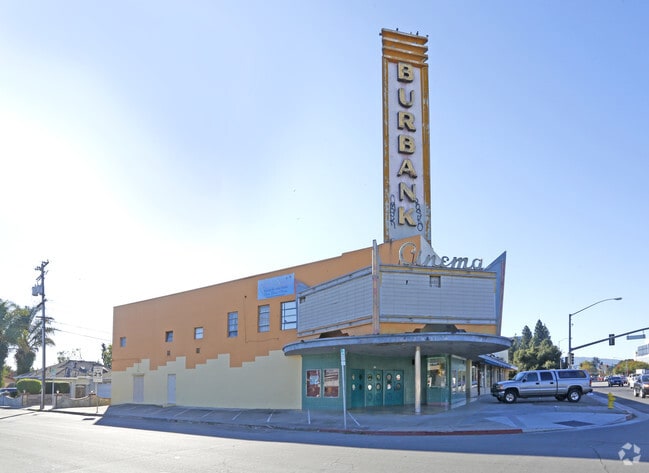
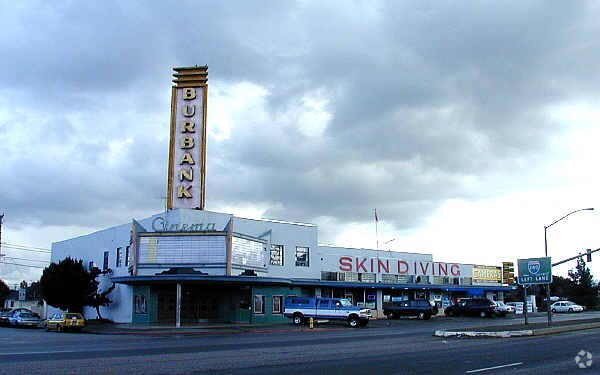
552 S Bascom Ave, San Jose, CA 95128

Property Detail
552 S Bascom Ave
277-29-045
SANTA CLARA
Storebuilding
California
CG
274
D Areas with possible but undetermined flood hazards.
0.46 AC
2024
Midtown San Jose
2025
South Bay/San Jose
502002
San Jose-Sunnyvale-Santa Clara, CA
14,112 SF
NEARBY LISTINGS FOR SALE OR LEASE
DEMOGRAPHICS near 552 S Bascom Ave
1 mile
3 mile
5 mile
2025 Total Population
28,913
260,497
624,064
2030 Population
29,579
267,870
639,052
Pop Growth 2025-2030
+ 2.30%
+ 2.83%
+ 2.40%
Average Age
39
39
39
2025 Total Households
11,251
101,623
225,143
HH Growth 2025-2030
+ 2.23%
+ 2.95%
+ 2.50%
Median Household Inc
$121,155
$127,844
$138,896
Avg Household Size
2.50
2.50
2.60
2025 Avg HH Vehicles
2.00
2.00
2.00
Median Home Value
$1,095,479
$1,107,011
$1,105,272
Median Year Built
1970
1970
1970
Nearby Places
Map Layers
Map Styles
 Street
 Aerial
Transit
 Traffic
 Biking
Places
Listings with unknown addresses are not visible on the map
- Restaurants
- Banks
- Shops
- Fitness
- Groceries
PUBLIC TRANSPORTATION
COMMUTER RAIL
San Jose Diridon Caltrain Station Southbound (Express - Caltrain (Caltrain), Limited - Caltrain (Caltrain), Local Weekday - Caltrain (Caltrain), Local Weekend - Caltrain (Caltrain), South Santa Clara County Connector - Caltrain (Caltrain))
Drive
Walk
Distance
San Jose Diridon Caltrain Station Southbound (Express - Caltrain (Caltrain), Limited - Caltrain (Caltrain), Local Weekday - Caltrain (Caltrain), Local Weekend - Caltrain (Caltrain), South Santa Clara County Connector - Caltrain (Caltrain))
5 min
2.3 mi
San Jose (Capitol Corridor - Capitol Corridor Joint Powers Authority)
Drive
Walk
Distance
San Jose (Capitol Corridor - Capitol Corridor Joint Powers Authority)
6 min
2.7 mi
AIRPORT
Norman Y Mineta San Jose International
Drive
Walk
Distance
Norman Y Mineta San Jose International
7 min
3.6 mi
Freight Ports
Port of Redwood City
Drive
Walk
Distance
Port of Redwood City
32 min
24.3 mi
SALE & LEASE HISTORY
LISTING DATE
SALE/LEASE

Oct 22, 2020
For Sale
Nov 09, 2018
For Lease
Jan 03, 2020
For Sale
Nearby Properties
Address
Land Use
TOTAL SIZE
Lot Size
Zoning
Address
Land Use
TOTAL SIZE
Lot Size
Zoning
2.50 AC
DC
Address
Land Use
TOTAL SIZE
Lot Size
Zoning
576,892 SF
8.28 AC
APD
Address
Land Use
TOTAL SIZE
Lot Size
Zoning
194,790 SF
5.30 AC
APDCI
Address
Land Use
TOTAL SIZE
Lot Size
Zoning
1.73 AC
DC
Address
Land Use
TOTAL SIZE
Lot Size
Zoning
837,391 SF
1.42 AC
DC
Address
Land Use
TOTAL SIZE
Lot Size
Zoning
1,121,228 SF
7.68 AC
RM(PD
Address
Land Use
TOTAL SIZE
Lot Size
Zoning
4.56 AC
CP
Address
Land Use
TOTAL SIZE
Lot Size
Zoning
252,210 SF
15.85 AC
C2S
Address
Land Use
TOTAL SIZE
Lot Size
Zoning
457,162 SF
3.97 AC
A(PD)
Address
Land Use
TOTAL SIZE
Lot Size
Zoning
486,104 SF
5.43 AC
ML
Address
Land Use
TOTAL SIZE
Lot Size
Zoning
617,814 SF
21.96 AC
CG
Address
Land Use
TOTAL SIZE
Lot Size
Zoning
67,435 SF
11.93 AC
C2
Address
Land Use
TOTAL SIZE
Lot Size
Zoning
557,448 SF
1.46 AC
DC
Address
Land Use
TOTAL SIZE
Lot Size
Zoning
333,472 SF
1.24 AC
APD
Address
Land Use
TOTAL SIZE
Lot Size
Zoning
289,503 SF
0.97 AC
DC
Address
Land Use
TOTAL SIZE
Lot Size
Zoning
330,927 SF
2.35 AC
M1
Address
Land Use
TOTAL SIZE
Lot Size
Zoning
3.40 AC
APD
Address
Land Use
TOTAL SIZE
Lot Size
Zoning
298,461 SF
5.45 AC
C3H
Address
Land Use
TOTAL SIZE
Lot Size
Zoning
340,000 SF
0.65 AC
CG(PD
Address
Land Use
TOTAL SIZE
Lot Size
Zoning
4.75 AC
CP-PD
Address
Land Use
TOTAL SIZE
Lot Size
Zoning
234,622 SF
1.89 AC
A(PD)
Address
Land Use
TOTAL SIZE
Lot Size
Zoning
194,549 SF
2.76 AC
APDCI
Address
Land Use
TOTAL SIZE
Lot Size
Zoning
381,000 SF
1.40 AC
DC
Address
Land Use
TOTAL SIZE
Lot Size
Zoning
116,953 SF
8.61 AC
C-2
Address
Land Use
TOTAL SIZE
Lot Size
Zoning
491,622 SF
4.18 AC
A(PD)
Address
Land Use
TOTAL SIZE
Lot Size
Zoning
286,350 SF
0.80 AC
C
Address
Land Use
TOTAL SIZE
Lot Size
Zoning
299,278 SF
3.67 AC
M1
Address
Land Use
TOTAL SIZE
Lot Size
Zoning
16.11 AC
CG
Address
Land Use
TOTAL SIZE
Lot Size
Zoning
279,360 SF
9.04 AC
R3
The World's #1 Commercial Real Estate Marketplace
Connect with us
© 2026 CoStar Group
The information above has been obtained from sources believed reliable. While we do not doubt its accuracy we have not verified it and make no guarantee, warranty or representation about it. It is your responsibility to independently confirm its accuracy and completeness. Any projections, opinions, assumptions, or estimates used are for example only and do not represent the current or future performance of the property. The value of this transaction to you depends on tax and other factors which should be evaluated by your tax, financial, and legal advisors. You and your advisors should conduct a careful, independent investigation of the property to determine to your satisfaction the suitability of the property for your needs.