Property Record
587 Cinnabar St, San Jose, CA 95110

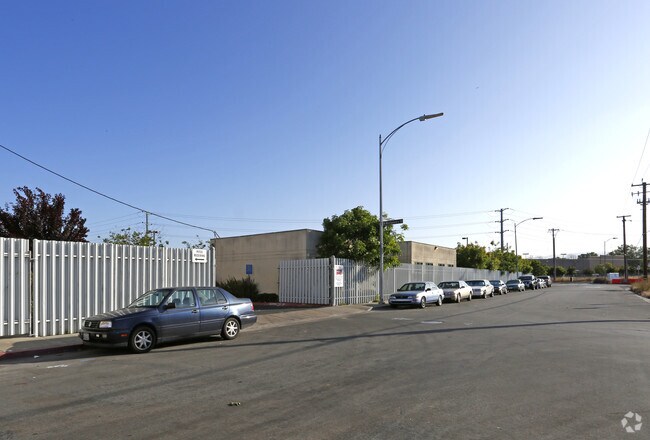
Property Detail
587 Cinnabar St
Warehouse
SANTA CLARA COUNTY
DC(PD
California
C and X Area of minimal flood hazard, usually depicted on FIRMs as above the 500-year flood level.
6.83 AC
2024
Downtown San Jose
2025
South Bay/San Jose
500800
San Jose-Sunnyvale-Santa Clara, CA
201,940 SF
259-26-017
NEARBY LISTINGS FOR SALE OR LEASE
DEMOGRAPHICS near 587 Cinnabar St
1 mile
3 mile
5 mile
2025 Total Population
28,708
235,179
676,733
2030 Population
30,315
241,711
691,103
Pop Growth 2025-2030
+ 5.60%
+ 2.78%
+ 2.12%
Average Age
40
38
39
2025 Total Households
13,013
86,055
231,448
HH Growth 2025-2030
+ 5.93%
+ 2.97%
+ 2.31%
Median Household Inc
$123,713
$115,276
$129,252
Avg Household Size
2.10
2.50
2.80
2025 Avg HH Vehicles
2.00
2.00
2.00
Median Home Value
$1,062,456
$1,077,313
$1,070,379
Median Year Built
1997
1972
1974
Nearby Places
Map Layers
Map Styles
 Street
 Aerial
Layers
 Traffic
 Biking
Places
Listings with unknown addresses are not visible on the map
- Restaurants
- Banks
- Shops
- Fitness
- Groceries
PUBLIC TRANSPORTATION
TRANSIT/SUBWAY
San Jose Diridon (Caltrain - Caltrain (Caltrain))
Drive
Walk
Distance
San Jose Diridon (Caltrain - Caltrain (Caltrain))
3 min
14 min
0.7 mi
San Jose Diridon Station (Mountain View - Winchester Line - Santa Clara VTA Light Rail)
Drive
Walk
Distance
San Jose Diridon Station (Mountain View - Winchester Line - Santa Clara VTA Light Rail)
4 min
15 min
0.8 mi
San Fernando Station (Mountain View - Winchester Line - Santa Clara VTA Light Rail)
Drive
Walk
Distance
San Fernando Station (Mountain View - Winchester Line - Santa Clara VTA Light Rail)
3 min
16 min
0.8 mi
COMMUTER RAIL
Drive
Walk
Distance
2 min
13 min
0.7 mi
Drive
Walk
Distance
3 min
14 min
0.7 mi
AIRPORT
Norman Y Mineta San Jose International
Drive
Walk
Distance
Norman Y Mineta San Jose International
7 min
3.1 mi
San Francisco International
Drive
Walk
Distance
San Francisco International
46 min
36.2 mi
Metro Oakland International
Drive
Walk
Distance
Metro Oakland International
47 min
36.6 mi
Freight Ports
Port of Redwood City
Drive
Walk
Distance
Port of Redwood City
31 min
23.0 mi
Nearby Properties
Address
Land Use
TOTAL SIZE
Lot Size
Zoning
Address
Land Use
TOTAL SIZE
Lot Size
Zoning
2.50 AC
DC
Address
Land Use
TOTAL SIZE
Lot Size
Zoning
576,892 SF
8.28 AC
APD
Address
Land Use
TOTAL SIZE
Lot Size
Zoning
360,000 SF
18.81 AC
MH
Address
Land Use
TOTAL SIZE
Lot Size
Zoning
194,790 SF
5.30 AC
APDCI
Address
Land Use
TOTAL SIZE
Lot Size
Zoning
1.73 AC
DC
Address
Land Use
TOTAL SIZE
Lot Size
Zoning
837,391 SF
1.42 AC
DC
Address
Land Use
TOTAL SIZE
Lot Size
Zoning
2.99 AC
MH
Address
Land Use
TOTAL SIZE
Lot Size
Zoning
242,320 SF
8.01 AC
TEC
Address
Land Use
TOTAL SIZE
Lot Size
Zoning
4.56 AC
CP
Address
Land Use
TOTAL SIZE
Lot Size
Zoning
281,574 SF
32.09 AC
IP
Address
Land Use
TOTAL SIZE
Lot Size
Zoning
320,000 SF
15.18 AC
APD
Address
Land Use
TOTAL SIZE
Lot Size
Zoning
2.99 AC
MH
Address
Land Use
TOTAL SIZE
Lot Size
Zoning
457,162 SF
3.97 AC
A(PD)
Address
Land Use
TOTAL SIZE
Lot Size
Zoning
486,104 SF
5.43 AC
ML
Address
Land Use
TOTAL SIZE
Lot Size
Zoning
617,814 SF
21.96 AC
CG
Address
Land Use
TOTAL SIZE
Lot Size
Zoning
194,530 SF
12.26 AC
APD
Address
Land Use
TOTAL SIZE
Lot Size
Zoning
590,000 SF
2.33 AC
C3
Address
Land Use
TOTAL SIZE
Lot Size
Zoning
557,448 SF
1.46 AC
DC
Address
Land Use
TOTAL SIZE
Lot Size
Zoning
333,472 SF
1.24 AC
APD
Address
Land Use
TOTAL SIZE
Lot Size
Zoning
290,589 SF
15.09 AC
IP
Address
Land Use
TOTAL SIZE
Lot Size
Zoning
289,503 SF
0.97 AC
DC
Address
Land Use
TOTAL SIZE
Lot Size
Zoning
330,927 SF
2.35 AC
M1
Address
Land Use
TOTAL SIZE
Lot Size
Zoning
445,687 SF
6.44 AC
A(PD)
Address
Land Use
TOTAL SIZE
Lot Size
Zoning
3.40 AC
APD
Address
Land Use
TOTAL SIZE
Lot Size
Zoning
2.99 AC
MH
Address
Land Use
TOTAL SIZE
Lot Size
Zoning
298,461 SF
5.45 AC
C3H
Address
Land Use
TOTAL SIZE
Lot Size
Zoning
340,000 SF
0.65 AC
CG(PD
Address
Land Use
TOTAL SIZE
Lot Size
Zoning
4.75 AC
CP-PD
Address
Land Use
TOTAL SIZE
Lot Size
Zoning
234,622 SF
1.89 AC
A(PD)
The World's #1 Commercial Real Estate Marketplace
Connect with us
© 2026 CoStar Group
The information above has been obtained from sources believed reliable. While we do not doubt its accuracy we have not verified it and make no guarantee, warranty or representation about it. It is your responsibility to independently confirm its accuracy and completeness. Any projections, opinions, assumptions, or estimates used are for example only and do not represent the current or future performance of the property. The value of this transaction to you depends on tax and other factors which should be evaluated by your tax, financial, and legal advisors. You and your advisors should conduct a careful, independent investigation of the property to determine to your satisfaction the suitability of the property for your needs.