Property Record
6465 Sycamore Canyon Blvd, Riverside, CA 92507
Current Lease Availabilities
NEARBY LISTINGS FOR SALE OR LEASE
Property Detail
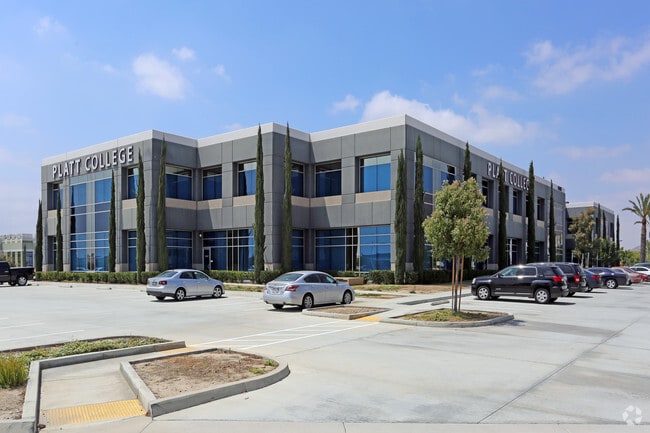
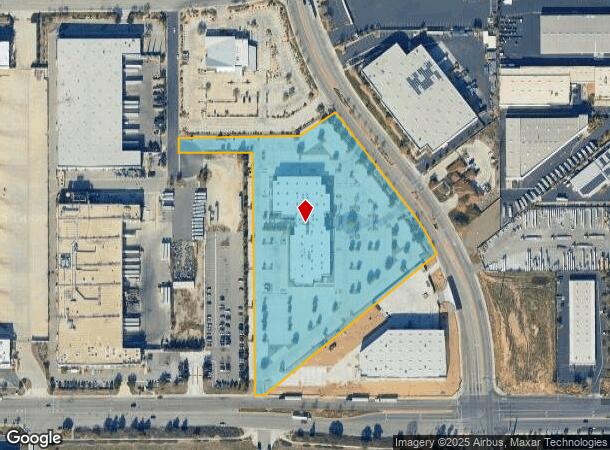
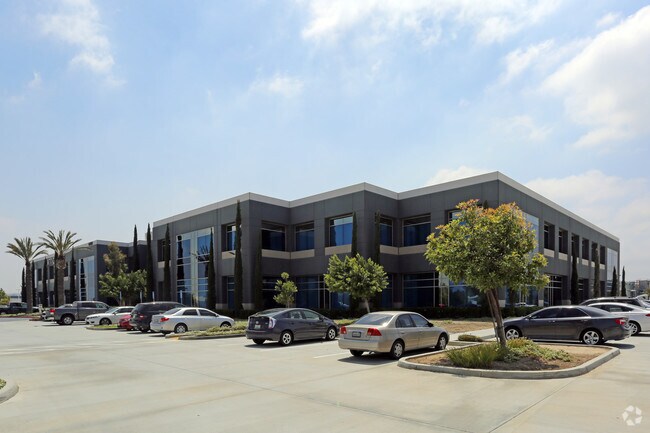
6465 Sycamore Canyon Blvd
Riverside-San Bernardino-Ontario, CA
Lot Line Adjustment No P07 1258
263-290-079
8.02 ACRES IN POR PAR 7 PM 220/011 PM 33246
Officebuilding
Riverside
X
California
06065C0745G
7
2024
8.02 AC
2025
Moreno Valley/Perris
050901
Inland Empire (California)
46,360 SF
DEMOGRAPHICS near 6465 Sycamore Canyon Blvd
1 Mile
3 Mile
5 Mile
2024 Total Population
4,478
86,143
244,512
2029 Population
4,780
90,700
256,849
Pop Growth 2024-2029
+ 6.74%
+ 5.29%
+ 5.05%
Average Age
33
35
35
2024 Total Households
1,736
26,686
70,216
HH Growth 2024-2029
+ 6.57%
+ 4.94%
+ 4.70%
Median Household Inc
$86,332
$80,546
$78,783
Avg Household Size
2.60
3.10
3.20
2024 Avg HH Vehicles
2.00
2.00
2.00
Median Home Value
$459,090
$497,966
$461,004
Median Year Built
1996
1988
1984
Nearby Places
Map Layers
Map Styles
 Street
 Aerial
- Restaurants
- Banks
- Shops
- Fitness
- Groceries
PUBLIC TRANSPORTATION
COMMUTER RAIL
Moreno Valley/March Field (Metrolink 91-Perris Valley Line - Metrolink Trains)
DRIVE
WALK
Distance
Moreno Valley/March Field (Metrolink 91-Perris Valley Line - Metrolink Trains)
4 min
1.8 mi
Riverside-Hunter Park/Ucr (Metrolink 91-Perris Valley Line - Metrolink Trains)
DRIVE
WALK
Distance
Riverside-Hunter Park/Ucr (Metrolink 91-Perris Valley Line - Metrolink Trains)
11 min
6.2 mi
AIRPORT
Ontario International
DRIVE
WALK
Distance
Ontario International
31 min
23.0 mi
Freight Ports
Port of Long Beach
DRIVE
WALK
Distance
Port of Long Beach
82 min
62.2 mi
Nearby Properties
Address
Land Use
TOTAL SIZE
Lot Size
Zoning
Address
Land Use
TOTAL SIZE
Lot Size
Zoning
1,101,504 SF
59.45 AC
Address
Land Use
TOTAL SIZE
Lot Size
Zoning
709,081 SF
33.17 AC
Address
Land Use
TOTAL SIZE
Lot Size
Zoning
617,000 SF
23.91 AC
W2
Address
Land Use
TOTAL SIZE
Lot Size
Zoning
1,280,446 SF
51.47 AC
Address
Land Use
TOTAL SIZE
Lot Size
Zoning
1,012,995 SF
47.62 AC
Address
Land Use
TOTAL SIZE
Lot Size
Zoning
929,918 SF
52.44 AC
Address
Land Use
TOTAL SIZE
Lot Size
Zoning
361,346 SF
18.17 AC
Address
Land Use
TOTAL SIZE
Lot Size
Zoning
607,644 SF
26.09 AC
O
Address
Land Use
TOTAL SIZE
Lot Size
Zoning
596,090 SF
29.17 AC
IP
Address
Land Use
TOTAL SIZE
Lot Size
Zoning
95,047 SF
10.25 AC
Address
Land Use
TOTAL SIZE
Lot Size
Zoning
397,994 SF
19.70 AC
H
Address
Land Use
TOTAL SIZE
Lot Size
Zoning
26.96 AC
R3
Address
Land Use
TOTAL SIZE
Lot Size
Zoning
283,209 SF
16.91 AC
R20
Address
Land Use
TOTAL SIZE
Lot Size
Zoning
302,116 SF
30.19 AC
RA
Address
Land Use
TOTAL SIZE
Lot Size
Zoning
620,533 SF
32.50 AC
Address
Land Use
TOTAL SIZE
Lot Size
Zoning
449,040 SF
18.86 AC
BMP
Address
Land Use
TOTAL SIZE
Lot Size
Zoning
126,036 SF
30.90 AC
Address
Land Use
TOTAL SIZE
Lot Size
Zoning
91,891 SF
20.61 AC
R20
Address
Land Use
TOTAL SIZE
Lot Size
Zoning
38,560 SF
12.04 AC
R3
Address
Land Use
TOTAL SIZE
Lot Size
Zoning
579,807 SF
30.23 AC
MP
Address
Land Use
TOTAL SIZE
Lot Size
Zoning
430,647 SF
31.09 AC
Address
Land Use
TOTAL SIZE
Lot Size
Zoning
399,615 SF
24.31 AC
Address
Land Use
TOTAL SIZE
Lot Size
Zoning
38,400 SF
15.73 AC
R3
Address
Land Use
TOTAL SIZE
Lot Size
Zoning
486,000 SF
24.62 AC
Address
Land Use
TOTAL SIZE
Lot Size
Zoning
262,260 SF
13.35 AC
RR
Address
Land Use
TOTAL SIZE
Lot Size
Zoning
252,504 SF
13.11 AC
SP
Address
Land Use
TOTAL SIZE
Lot Size
Zoning
522,772 SF
26.26 AC
LI
Address
Land Use
TOTAL SIZE
Lot Size
Zoning
37,010 SF
12.13 AC
Address
Land Use
TOTAL SIZE
Lot Size
Zoning
Address
Land Use
TOTAL SIZE
Lot Size
Zoning
209,734 SF
10.87 AC
R3
The World's #1 Commercial Real Estate Marketplace
Connect with us
© 2025 CoStar Group
The information above has been obtained from sources believed reliable. While we do not doubt its accuracy we have not verified it and make no guarantee, warranty or representation about it. It is your responsibility to independently confirm its accuracy and completeness. Any projections, opinions, assumptions, or estimates used are for example only and do not represent the current or future performance of the property. The value of this transaction to you depends on tax and other factors which should be evaluated by your tax, financial, and legal advisors. You and your advisors should conduct a careful, independent investigation of the property to determine to your satisfaction the suitability of the property for your needs.