Property Record
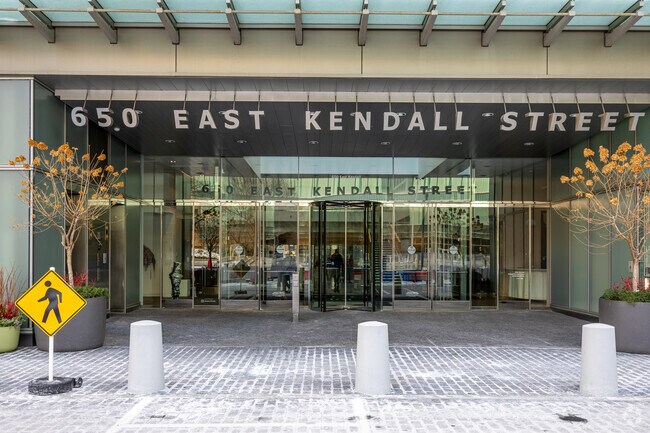
650 E Kendall St, Cambridge, MA 02142


Property Detail
650 E Kendall St
CAMB-000014-000000-000045
MIDDLESEX
Industrialgeneral
Massachusetts
PUD-3
45
B and X Area of moderate flood hazard, usually the area between the limits of the 100-year and 500-year floods.
1.14 AC
2024
E Cambridge/Kendall Sq
2025
Boston
352300
Boston-Cambridge-Newton, MA-NH
NEARBY LISTINGS FOR SALE OR LEASE
DEMOGRAPHICS near 650 E Kendall St
1 mile
3 mile
5 mile
2025 Total Population
56,769
534,569
1,034,582
2030 Population
59,305
553,910
1,062,015
Pop Growth 2025-2030
+ 4.47%
+ 3.62%
+ 2.65%
Average Age
37
36
37
2025 Total Households
28,429
230,944
425,709
HH Growth 2025-2030
+ 4.89%
+ 4.05%
+ 3.04%
Median Household Inc
$137,601
$110,099
$105,413
Avg Household Size
1.80
2.00
2.20
2025 Avg HH Vehicles
1.00
1.00
1.00
Median Home Value
$1,036,136
$949,492
$848,098
Median Year Built
1952
1954
1949
Nearby Places
Map Layers
Map Styles
 Street
 Aerial
Transit
 Traffic
 Biking
Places
Listings with unknown addresses are not visible on the map
- Restaurants
- Banks
- Shops
- Fitness
- Groceries
PUBLIC TRANSPORTATION
TRANSIT/SUBWAY
Kendall Station (Red Line - Massachusetts Bay Transportation Authority Subway (The T))
Drive
Walk
Distance
Kendall Station (Red Line - Massachusetts Bay Transportation Authority Subway (The T))
2 min
7 min
0.4 mi
Lechmere Station (Green Line - E - Massachusetts Bay Transportation Authority Subway (The T))
Drive
Walk
Distance
Lechmere Station (Green Line - E - Massachusetts Bay Transportation Authority Subway (The T))
1 min
9 min
0.5 mi
Charles/Mgh Station (Red Line - Massachusetts Bay Transportation Authority Subway (The T))
Drive
Walk
Distance
Charles/Mgh Station (Red Line - Massachusetts Bay Transportation Authority Subway (The T))
2 min
16 min
0.8 mi
Science Park Station (Green Line - E - Massachusetts Bay Transportation Authority Subway (The T))
Drive
Walk
Distance
Science Park Station (Green Line - E - Massachusetts Bay Transportation Authority Subway (The T))
5 min
18 min
0.9 mi
Community College Station (Orange Line - Massachusetts Bay Transportation Authority Subway (The T))
Drive
Walk
Distance
Community College Station (Orange Line - Massachusetts Bay Transportation Authority Subway (The T))
7 min
19 min
1.0 mi
COMMUTER RAIL
North Station (Fitchburg/South Acton Line - Massachusetts Bay Transportation Authority Commuter Rail (Purple Line), Haverhill Line - Massachusetts Bay Transportation Authority Commuter Rail (Purple Line), Lowell Line - Massachusetts Bay Transportation Authority Commuter Rail (Purple Line), Newburyport/Rockport Line - Massachusetts Bay Transportation Authority Commuter Rail (Purple Line))
Drive
Walk
Distance
North Station (Fitchburg/South Acton Line - Massachusetts Bay Transportation Authority Commuter Rail (Purple Line), Haverhill Line - Massachusetts Bay Transportation Authority Commuter Rail (Purple Line), Lowell Line - Massachusetts Bay Transportation Authority Commuter Rail (Purple Line), Newburyport/Rockport Line - Massachusetts Bay Transportation Authority Commuter Rail (Purple Line))
4 min
1.5 mi
Back Bay Station (Framingham/Worcester Line - Massachusetts Bay Transportation Authority Commuter Rail (Purple Line), Franklin Line - Massachusetts Bay Transportation Authority Commuter Rail (Purple Line), Needham Line - Massachusetts Bay Transportation Authority Commuter Rail (Purple Line), Orange Line - Massachusetts Bay Transportation Authority Commuter Rail (Purple Line), Providence/Stoughton Line - Massachusetts Bay Transportation Authority Commuter Rail (Purple Line))
Drive
Walk
Distance
Back Bay Station (Framingham/Worcester Line - Massachusetts Bay Transportation Authority Commuter Rail (Purple Line), Franklin Line - Massachusetts Bay Transportation Authority Commuter Rail (Purple Line), Needham Line - Massachusetts Bay Transportation Authority Commuter Rail (Purple Line), Orange Line - Massachusetts Bay Transportation Authority Commuter Rail (Purple Line), Providence/Stoughton Line - Massachusetts Bay Transportation Authority Commuter Rail (Purple Line))
8 min
2.2 mi
AIRPORT
General Edward Lawrence Logan International
Drive
Walk
Distance
General Edward Lawrence Logan International
10 min
4.6 mi
Freight Ports
Port of Boston
Drive
Walk
Distance
Port of Boston
11 min
4.3 mi
Nearby Properties
Address
Land Use
TOTAL SIZE
Lot Size
Zoning
Address
Land Use
TOTAL SIZE
Lot Size
Zoning
909,764 SF
25.13 AC
E
Address
Land Use
TOTAL SIZE
Lot Size
Zoning
610,560 SF
4.01 AC
E
Address
Land Use
TOTAL SIZE
Lot Size
Zoning
408,667 SF
3.27 AC
C
Address
Land Use
TOTAL SIZE
Lot Size
Zoning
439,500 SF
9.21 AC
E
Address
Land Use
TOTAL SIZE
Lot Size
Zoning
825,000 SF
5.17 AC
E
Address
Land Use
TOTAL SIZE
Lot Size
Zoning
125,571 SF
3.25 AC
C-3
Address
Land Use
TOTAL SIZE
Lot Size
Zoning
6.39 AC
C
Address
Land Use
TOTAL SIZE
Lot Size
Zoning
596,972 SF
7.32 AC
E
Address
Land Use
TOTAL SIZE
Lot Size
Zoning
171,791 SF
166.88 AC
E
Address
Land Use
TOTAL SIZE
Lot Size
Zoning
530,200 SF
62.08 AC
E
Address
Land Use
TOTAL SIZE
Lot Size
Zoning
173,400 SF
1.14 AC
MXD
Address
Land Use
TOTAL SIZE
Lot Size
Zoning
142,458 SF
1.67 AC
C-3
Address
Land Use
TOTAL SIZE
Lot Size
Zoning
334,522 SF
1.26 AC
C
Address
Land Use
TOTAL SIZE
Lot Size
Zoning
312,269 SF
0.43 AC
C
Address
Land Use
TOTAL SIZE
Lot Size
Zoning
230,394 SF
0.60 AC
MXD
Address
Land Use
TOTAL SIZE
Lot Size
Zoning
46,259 SF
1.05 AC
E
Address
Land Use
TOTAL SIZE
Lot Size
Zoning
118,759 SF
0.92 AC
C
Address
Land Use
TOTAL SIZE
Lot Size
Zoning
304,349 SF
1.72 AC
Address
Land Use
TOTAL SIZE
Lot Size
Zoning
3.52 AC
C-3
Address
Land Use
TOTAL SIZE
Lot Size
Zoning
377,634 SF
4.86 AC
E
Address
Land Use
TOTAL SIZE
Lot Size
Zoning
1.13 AC
C
Address
Land Use
TOTAL SIZE
Lot Size
Zoning
239,377 SF
0.71 AC
MXD
Address
Land Use
TOTAL SIZE
Lot Size
Zoning
419,722 SF
2.03 AC
RC
Address
Land Use
TOTAL SIZE
Lot Size
Zoning
3.75 AC
C
Address
Land Use
TOTAL SIZE
Lot Size
Zoning
227,107 SF
7.70 AC
E
Address
Land Use
TOTAL SIZE
Lot Size
Zoning
2.81 AC
O-2
Address
Land Use
TOTAL SIZE
Lot Size
Zoning
448,796 SF
1.84 AC
C
Address
Land Use
TOTAL SIZE
Lot Size
Zoning
254,208 SF
3.83 AC
E
Address
Land Use
TOTAL SIZE
Lot Size
Zoning
4,355 SF
13.12 AC
E
Address
Land Use
TOTAL SIZE
Lot Size
Zoning
341,500 SF
1.18 AC
RC
The World's #1 Commercial Real Estate Marketplace
Connect with us
© 2026 CoStar Group
The information above has been obtained from sources believed reliable. While we do not doubt its accuracy we have not verified it and make no guarantee, warranty or representation about it. It is your responsibility to independently confirm its accuracy and completeness. Any projections, opinions, assumptions, or estimates used are for example only and do not represent the current or future performance of the property. The value of this transaction to you depends on tax and other factors which should be evaluated by your tax, financial, and legal advisors. You and your advisors should conduct a careful, independent investigation of the property to determine to your satisfaction the suitability of the property for your needs.