Property Record
74 E 4100 N, Hyde Park, UT 84318
Property Detail
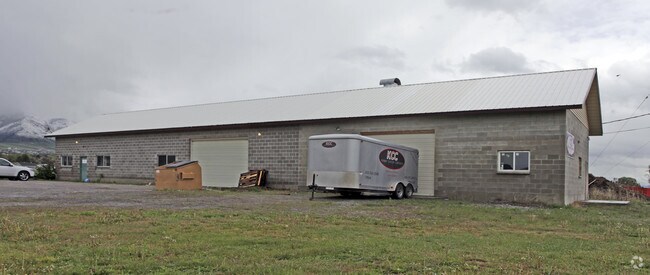
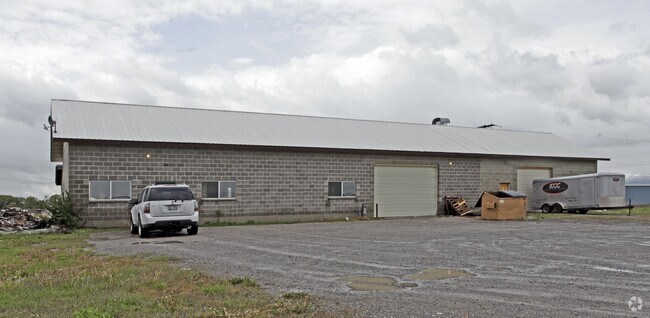
74 E 4100 N
Logan, UT-ID
BEG AT NW COR SEC 3 T 12N R 1E & TH N 8938'11 E 302.52 FT TH S 024'17 E 3571.56 FT TO E LN OF US HWY 91 & S LN OF 4100 N ST A
04-008-0046
CACHE
Realpropertynec
Utah
B and X Area of moderate flood hazard, usually the area between the limits of the 100-year and 500-year floods.
23
2025
1 AC
2025
Cache County
000403
Salt Lake City
3,720 SF
NEARBY LISTINGS FOR SALE OR LEASE
DEMOGRAPHICS near 74 E 4100 N
1 mile
3 mile
5 mile
2025 Total Population
2,469
30,647
72,719
2030 Population
2,598
32,734
77,096
Pop Growth 2025-2030
+ 5.22%
+ 6.81%
+ 6.02%
Average Age
35
34
31
2025 Total Households
733
9,313
23,216
HH Growth 2025-2030
+ 5.73%
+ 7.33%
+ 6.47%
Median Household Inc
$82,158
$94,916
$74,572
Avg Household Size
3.30
3.30
2.90
2025 Avg HH Vehicles
2.00
2.00
2.00
Median Home Value
$448,728
$490,794
$467,886
Median Year Built
1988
2002
1991
Nearby Places
Map Layers
Map Styles
 Street
 Aerial
Transit
 Traffic
 Biking
Places
Listings with unknown addresses are not visible on the map
- Restaurants
- Banks
- Shops
- Fitness
- Groceries
Nearby Properties
Address
Land Use
TOTAL SIZE
Lot Size
Zoning
Address
Land Use
TOTAL SIZE
Lot Size
Zoning
23,756 SF
16.99 AC
Address
Land Use
TOTAL SIZE
Lot Size
Zoning
26,440 SF
7.78 AC
Address
Land Use
TOTAL SIZE
Lot Size
Zoning
9,327 SF
7.35 AC
Address
Land Use
TOTAL SIZE
Lot Size
Zoning
114,290 SF
7 AC
Address
Land Use
TOTAL SIZE
Lot Size
Zoning
67,554 SF
10.22 AC
Address
Land Use
TOTAL SIZE
Lot Size
Zoning
47,865 SF
2.28 AC
Address
Land Use
TOTAL SIZE
Lot Size
Zoning
80,080 SF
6.36 AC
Address
Land Use
TOTAL SIZE
Lot Size
Zoning
55,500 SF
7.22 AC
Address
Land Use
TOTAL SIZE
Lot Size
Zoning
6.19 AC
Address
Land Use
TOTAL SIZE
Lot Size
Zoning
99,715 SF
5.21 AC
Address
Land Use
TOTAL SIZE
Lot Size
Zoning
93,319 SF
10.60 AC
Address
Land Use
TOTAL SIZE
Lot Size
Zoning
95,103 SF
4.76 AC
Address
Land Use
TOTAL SIZE
Lot Size
Zoning
71,112 SF
4.76 AC
Address
Land Use
TOTAL SIZE
Lot Size
Zoning
73,586 SF
3.80 AC
Address
Land Use
TOTAL SIZE
Lot Size
Zoning
75,593 SF
10 AC
Address
Land Use
TOTAL SIZE
Lot Size
Zoning
96,789 SF
5.98 AC
Address
Land Use
TOTAL SIZE
Lot Size
Zoning
77,951 SF
11.20 AC
Address
Land Use
TOTAL SIZE
Lot Size
Zoning
77,075 SF
4.21 AC
Address
Land Use
TOTAL SIZE
Lot Size
Zoning
2,250 SF
18.79 AC
Address
Land Use
TOTAL SIZE
Lot Size
Zoning
28,287 SF
5.11 AC
Address
Land Use
TOTAL SIZE
Lot Size
Zoning
67,866 SF
4.51 AC
Address
Land Use
TOTAL SIZE
Lot Size
Zoning
66,753 SF
5.12 AC
Address
Land Use
TOTAL SIZE
Lot Size
Zoning
51,013 SF
4.42 AC
Address
Land Use
TOTAL SIZE
Lot Size
Zoning
60,454 SF
4.34 AC
Address
Land Use
TOTAL SIZE
Lot Size
Zoning
63,252 SF
3.85 AC
Address
Land Use
TOTAL SIZE
Lot Size
Zoning
83,305 SF
7.03 AC
Address
Land Use
TOTAL SIZE
Lot Size
Zoning
63,252 SF
3.94 AC
Address
Land Use
TOTAL SIZE
Lot Size
Zoning
66,753 SF
5.15 AC
Address
Land Use
TOTAL SIZE
Lot Size
Zoning
37,960 SF
1.53 AC
The World's #1 Commercial Real Estate Marketplace
Connect with us
© 2026 CoStar Group
The information above has been obtained from sources believed reliable. While we do not doubt its accuracy we have not verified it and make no guarantee, warranty or representation about it. It is your responsibility to independently confirm its accuracy and completeness. Any projections, opinions, assumptions, or estimates used are for example only and do not represent the current or future performance of the property. The value of this transaction to you depends on tax and other factors which should be evaluated by your tax, financial, and legal advisors. You and your advisors should conduct a careful, independent investigation of the property to determine to your satisfaction the suitability of the property for your needs.