Property Record
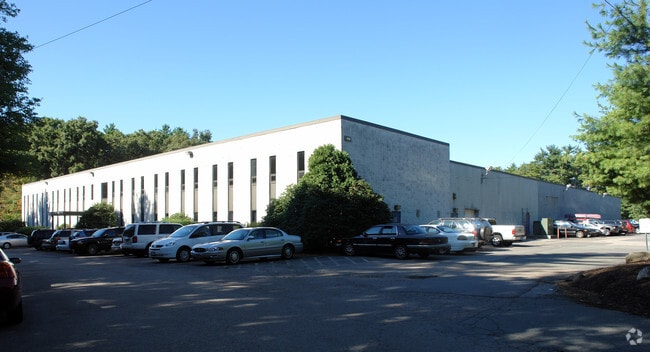
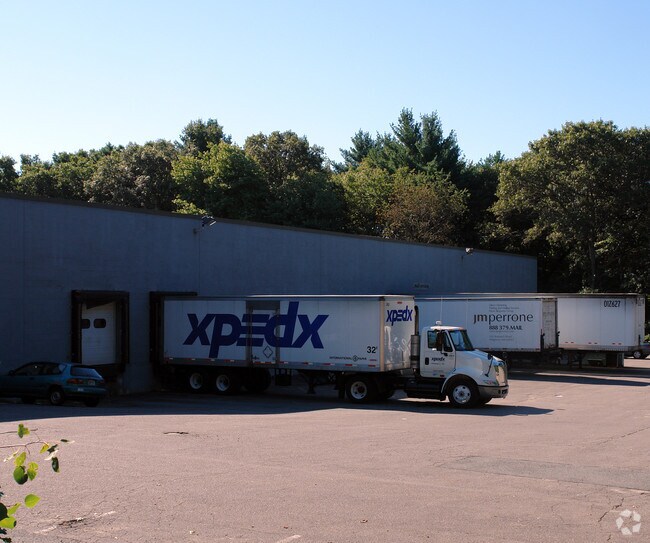
75 Abington St, Hingham, MA 02043

Property Detail
75 Abington St
HING-000206-000000-000012
Plymouth
Privateschool
Massachusetts
B and X Area of moderate flood hazard, usually the area between the limits of the 100-year and 500-year floods.
12
2025
8.25 AC
2025
Route 3 Corridor
501204
Boston
88,903 SF
Boston-Cambridge-Newton, MA-NH
NEARBY LISTINGS FOR SALE OR LEASE
DEMOGRAPHICS near 75 Abington St
1 mile
3 mile
5 mile
2025 Total Population
3,406
55,122
142,316
2030 Population
3,474
56,513
145,481
Pop Growth 2025-2030
+ 2.00%
+ 2.52%
+ 2.22%
Average Age
45
43
42
2025 Total Households
1,249
22,869
55,968
HH Growth 2025-2030
+ 2.16%
+ 2.62%
+ 2.33%
Median Household Inc
$157,108
$99,730
$115,651
Avg Household Size
2.60
2.30
2.50
2025 Avg HH Vehicles
2.00
2.00
2.00
Median Home Value
$720,705
$639,940
$669,865
Median Year Built
1963
1969
1964
Nearby Places
Map Layers
Map Styles
 Street
 Aerial
Layers
 Traffic
 Biking
Places
Listings with unknown addresses are not visible on the map
- Restaurants
- Banks
- Shops
- Fitness
- Groceries
PUBLIC TRANSPORTATION
COMMUTER RAIL
South Weymouth (Kingston/Plymouth Line - Massachusetts Bay Transportation Authority Commuter Rail (Purple Line))
Drive
Walk
Distance
South Weymouth (Kingston/Plymouth Line - Massachusetts Bay Transportation Authority Commuter Rail (Purple Line))
10 min
4.0 mi
East Weymouth (Greenbush Line - Massachusetts Bay Transportation Authority Commuter Rail (Purple Line))
Drive
Walk
Distance
East Weymouth (Greenbush Line - Massachusetts Bay Transportation Authority Commuter Rail (Purple Line))
12 min
4.3 mi
AIRPORT
General Edward Lawrence Logan International
Drive
Walk
Distance
General Edward Lawrence Logan International
34 min
20.8 mi
Freight Ports
Port of Boston
Drive
Walk
Distance
Port of Boston
31 min
18.6 mi
Nearby Properties
Address
Land Use
TOTAL SIZE
Lot Size
Zoning
Address
Land Use
TOTAL SIZE
Lot Size
Zoning
48.16 AC
Address
Land Use
TOTAL SIZE
Lot Size
Zoning
31.29 AC
100
Address
Land Use
TOTAL SIZE
Lot Size
Zoning
40,396 SF
5.56 AC
100
Address
Land Use
TOTAL SIZE
Lot Size
Zoning
Address
Land Use
TOTAL SIZE
Lot Size
Zoning
32.04 AC
Address
Land Use
TOTAL SIZE
Lot Size
Zoning
3.65 AC
100
Address
Land Use
TOTAL SIZE
Lot Size
Zoning
33.81 AC
A3
Address
Land Use
TOTAL SIZE
Lot Size
Zoning
7.62 AC
A2
Address
Land Use
TOTAL SIZE
Lot Size
Zoning
168,801 SF
2.75 AC
100
Address
Land Use
TOTAL SIZE
Lot Size
Zoning
0.42 AC
A1
Address
Land Use
TOTAL SIZE
Lot Size
Zoning
172,027 SF
3.73 AC
100
Address
Land Use
TOTAL SIZE
Lot Size
Zoning
144,377 SF
9.39 AC
Address
Land Use
TOTAL SIZE
Lot Size
Zoning
276,753 SF
25.44 AC
Address
Land Use
TOTAL SIZE
Lot Size
Zoning
170,035 SF
1.64 AC
100
Address
Land Use
TOTAL SIZE
Lot Size
Zoning
9.78 AC
M-1
Address
Land Use
TOTAL SIZE
Lot Size
Zoning
0.23 AC
A2
Address
Land Use
TOTAL SIZE
Lot Size
Zoning
0.16 AC
Address
Land Use
TOTAL SIZE
Lot Size
Zoning
147,069 SF
1.90 AC
Address
Land Use
TOTAL SIZE
Lot Size
Zoning
3.92 AC
R-4
Address
Land Use
TOTAL SIZE
Lot Size
Zoning
8.54 AC
100
Address
Land Use
TOTAL SIZE
Lot Size
Zoning
141,687 SF
17.27 AC
Address
Land Use
TOTAL SIZE
Lot Size
Zoning
1.48 AC
100
Address
Land Use
TOTAL SIZE
Lot Size
Zoning
34.28 AC
85
Address
Land Use
TOTAL SIZE
Lot Size
Zoning
13.40 AC
A3
Address
Land Use
TOTAL SIZE
Lot Size
Zoning
9.56 AC
A3
Address
Land Use
TOTAL SIZE
Lot Size
Zoning
2.81 AC
A3
Address
Land Use
TOTAL SIZE
Lot Size
Zoning
74,600 SF
6.29 AC
Address
Land Use
TOTAL SIZE
Lot Size
Zoning
85,338 SF
1.85 AC
Address
Land Use
TOTAL SIZE
Lot Size
Zoning
14.55 AC
A3
Address
Land Use
TOTAL SIZE
Lot Size
Zoning
237,417 SF
13.60 AC
The World's #1 Commercial Real Estate Marketplace
Connect with us
© 2026 CoStar Group
The information above has been obtained from sources believed reliable. While we do not doubt its accuracy we have not verified it and make no guarantee, warranty or representation about it. It is your responsibility to independently confirm its accuracy and completeness. Any projections, opinions, assumptions, or estimates used are for example only and do not represent the current or future performance of the property. The value of this transaction to you depends on tax and other factors which should be evaluated by your tax, financial, and legal advisors. You and your advisors should conduct a careful, independent investigation of the property to determine to your satisfaction the suitability of the property for your needs.