Property Record
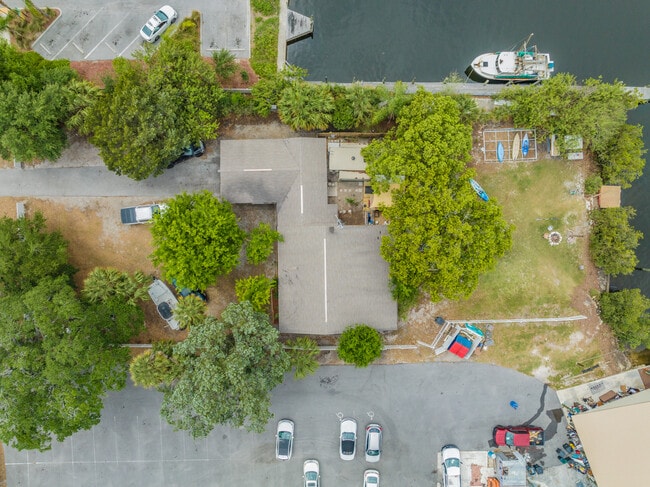
7915 Bayview St, Port Richey, FL 34668

NEARBY LISTINGS FOR SALE OR LEASE
-
-
View all Port Richey listings for sale on LoopNet.com
Property Detail
7915 Bayview St
Tampa-St. Petersburg-Clearwater, FL
H R Nicks
32-25-16-0000-00700-0000
H R NICKS SUB PB 2 PG 25 BLK 1 LOTS 6 & 7 & THAT POR OF THE VACATED BLVD SHOWN ON SAID PLAT LYING WEST OF LOTS 6 & 7 EXC THAT POR OF THE ABOVE LYING SOUTH OF FOLLOWING LINE COM SE COR LOT 7 BLK 1 FOR POB TH N86DG 18 05W 270.00 FT MORE OF LESS TO ORIG
Storesoffices
Pasco
AE
Florida
12101C0188G
6,7
2024
0.68 AC
2026
Pasco County
030205
Tampa/St Petersburg
1,111 SF
DEMOGRAPHICS near 7915 Bayview St
1 mile
3 mile
5 mile
2024 Total Population
6,038
61,191
142,671
2029 Population
7,273
73,542
171,283
Pop Growth 2024-2029
+ 20.45%
+ 20.18%
+ 20.05%
Average Age
46
45
45
2024 Total Households
2,760
27,508
62,394
HH Growth 2024-2029
+ 20.51%
+ 20.21%
+ 20.08%
Median Household Inc
$52,212
$43,931
$45,336
Avg Household Size
2.20
2.20
2.20
2024 Avg HH Vehicles
2.00
1.00
2.00
Median Home Value
$253,884
$166,432
$157,277
Median Year Built
1977
1978
1978
Nearby Places
Map Layers
Map Styles
 Street
 Aerial
Transit
 Traffic
 Biking
Places
Listings with unknown addresses are not visible on the map
- Restaurants
- Banks
- Shops
- Fitness
- Groceries
PUBLIC TRANSPORTATION
AIRPORT
Tampa International
Drive
Walk
Distance
Tampa International
53 min
31.4 mi
St Pete-Clearwater International
Drive
Walk
Distance
St Pete-Clearwater International
53 min
31.6 mi
Freight Ports
Port of Tampa Bay
Drive
Walk
Distance
Port of Tampa Bay
66 min
41.3 mi
Nearby Properties
Address
Land Use
TOTAL SIZE
Lot Size
Zoning
Address
Land Use
TOTAL SIZE
Lot Size
Zoning
395,386 SF
35.63 AC
C2
Address
Land Use
TOTAL SIZE
Lot Size
Zoning
799,241 SF
88.92 AC
PUD
Address
Land Use
TOTAL SIZE
Lot Size
Zoning
248,561 SF
14.17 AC
C
Address
Land Use
TOTAL SIZE
Lot Size
Zoning
241,429 SF
37.59 AC
C
Address
Land Use
TOTAL SIZE
Lot Size
Zoning
7,889 SF
63.58 AC
RMH
Address
Land Use
TOTAL SIZE
Lot Size
Zoning
351,012 SF
23.51 AC
MF2
Address
Land Use
TOTAL SIZE
Lot Size
Zoning
220,843 SF
35.13 AC
C2
Address
Land Use
TOTAL SIZE
Lot Size
Zoning
149,162 SF
3.10 AC
C
Address
Land Use
TOTAL SIZE
Lot Size
Zoning
163,106 SF
13.97 AC
C
Address
Land Use
TOTAL SIZE
Lot Size
Zoning
24.55 AC
MHP
Address
Land Use
TOTAL SIZE
Lot Size
Zoning
122,037 SF
13.83 AC
MF1
Address
Land Use
TOTAL SIZE
Lot Size
Zoning
121,284 SF
10.25 AC
MF1
Address
Land Use
TOTAL SIZE
Lot Size
Zoning
91,660 SF
16.29 AC
C
Address
Land Use
TOTAL SIZE
Lot Size
Zoning
220,045 SF
22.67 AC
C2
Address
Land Use
TOTAL SIZE
Lot Size
Zoning
309,759 SF
65.19 AC
AC
Address
Land Use
TOTAL SIZE
Lot Size
Zoning
183,139 SF
19.66 AC
C2
Address
Land Use
TOTAL SIZE
Lot Size
Zoning
7,149 SF
31.99 AC
AC
Address
Land Use
TOTAL SIZE
Lot Size
Zoning
4,336 SF
28.98 AC
RMH
Address
Land Use
TOTAL SIZE
Lot Size
Zoning
142,856 SF
20 AC
C
Address
Land Use
TOTAL SIZE
Lot Size
Zoning
7,456 SF
18.63 AC
RMH
Address
Land Use
TOTAL SIZE
Lot Size
Zoning
82,047 SF
21.48 AC
MF2
Address
Land Use
TOTAL SIZE
Lot Size
Zoning
4,520 SF
19.57 AC
RMH
Address
Land Use
TOTAL SIZE
Lot Size
Zoning
76,160 SF
6.74 AC
MPUD
Address
Land Use
TOTAL SIZE
Lot Size
Zoning
220,024 SF
25.72 AC
C1
Address
Land Use
TOTAL SIZE
Lot Size
Zoning
29.07 AC
MHP
Address
Land Use
TOTAL SIZE
Lot Size
Zoning
212,308 SF
10.91 AC
MF2
Address
Land Use
TOTAL SIZE
Lot Size
Zoning
41,156 SF
2.26 AC
C
Address
Land Use
TOTAL SIZE
Lot Size
Zoning
42,059 SF
9.16 AC
C3
Address
Land Use
TOTAL SIZE
Lot Size
Zoning
84,225 SF
5.21 AC
C2
Address
Land Use
TOTAL SIZE
Lot Size
Zoning
181,980 SF
11.12 AC
MF2
The World's #1 Commercial Real Estate Marketplace
Connect with us
© 2026 CoStar Group
The information above has been obtained from sources believed reliable. While we do not doubt its accuracy we have not verified it and make no guarantee, warranty or representation about it. It is your responsibility to independently confirm its accuracy and completeness. Any projections, opinions, assumptions, or estimates used are for example only and do not represent the current or future performance of the property. The value of this transaction to you depends on tax and other factors which should be evaluated by your tax, financial, and legal advisors. You and your advisors should conduct a careful, independent investigation of the property to determine to your satisfaction the suitability of the property for your needs.