Property Record
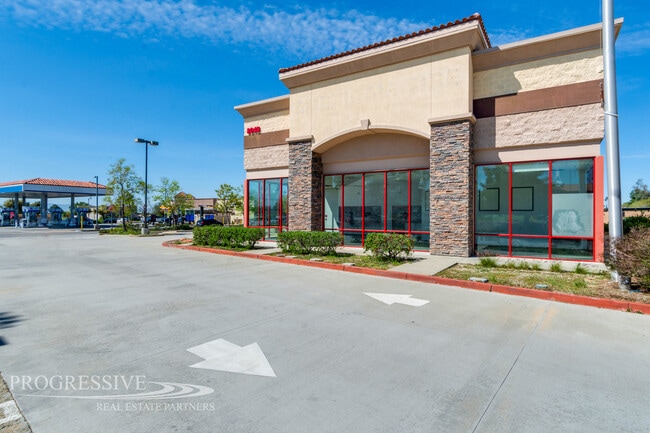
8048 Cherry Ave, Fontana, CA 92336


Current Lease Availabilities
Property Detail
8048 Cherry Ave
1100-121-55
A PORTION OF PARCELS 2, 3 AND 4 OF PARCEL MAP NO. 16829, IN THE CITY OF FONTANA, AS SHOWN BY MAP ON FILE IN BOOK 214, PAGES 23 THROUGH 25, INCLUSIVE OF PARCEL MAPS IN THE OFFICE OF THE COUNTY RECORDER OF SAN BERNARDINO COUNTY, CALIFORNIA, MORE PARTIC
Autorepair
San Bernardino
B and X Area of moderate flood hazard, usually the area between the limits of the 100-year and 500-year floods.
California
2025
1.09 AC
2025
Airport Area
002038
Inland Empire (California)
6,988 SF
Riverside-San Bernardino-Ontario, CA
NEARBY LISTINGS FOR SALE OR LEASE
DEMOGRAPHICS near 8048 Cherry Ave
1 mile
3 mile
5 mile
2025 Total Population
16,232
134,785
316,031
2030 Population
16,347
136,146
319,476
Pop Growth 2025-2030
+ 0.71%
+ 1.01%
+ 1.09%
Average Age
37
36
36
2025 Total Households
4,056
35,055
86,926
HH Growth 2025-2030
+ 0.64%
+ 1.02%
+ 1.13%
Median Household Inc
$119,062
$109,417
$107,135
Avg Household Size
3.90
3.70
3.50
2025 Avg HH Vehicles
3.00
3.00
2.00
Median Home Value
$636,307
$670,325
$674,563
Median Year Built
1991
1992
1990
Nearby Places
Map Layers
Map Styles
 Street
 Aerial
Layers
 Traffic
 Biking
Places
Listings with unknown addresses are not visible on the map
- Restaurants
- Banks
- Shops
- Fitness
- Groceries
PUBLIC TRANSPORTATION
COMMUTER RAIL
Fontana (San Bernardino Line - Southern California Regional Rail Authority (Metrolink))
Drive
Walk
Distance
Fontana (San Bernardino Line - Southern California Regional Rail Authority (Metrolink))
7 min
4.1 mi
Rancho Cucamonga (San Bernardino Line - Southern California Regional Rail Authority (Metrolink))
Drive
Walk
Distance
Rancho Cucamonga (San Bernardino Line - Southern California Regional Rail Authority (Metrolink))
9 min
5.4 mi
AIRPORT
Ontario International
Drive
Walk
Distance
Ontario International
15 min
9.5 mi
Freight Ports
Port of Long Beach
Drive
Walk
Distance
Port of Long Beach
77 min
61.8 mi
Nearby Properties
Address
Land Use
TOTAL SIZE
Lot Size
Zoning
Address
Land Use
TOTAL SIZE
Lot Size
Zoning
362.37 AC
Address
Land Use
TOTAL SIZE
Lot Size
Zoning
425.43 AC
SDCOM
Address
Land Use
TOTAL SIZE
Lot Size
Zoning
502,314 SF
40.06 AC
Address
Land Use
TOTAL SIZE
Lot Size
Zoning
912 SF
370.60 AC
IR
Address
Land Use
TOTAL SIZE
Lot Size
Zoning
1,286,569 SF
53.96 AC
Address
Land Use
TOTAL SIZE
Lot Size
Zoning
275,783 SF
11.82 AC
Address
Land Use
TOTAL SIZE
Lot Size
Zoning
261,114 SF
11.23 AC
Address
Land Use
TOTAL SIZE
Lot Size
Zoning
145,111 SF
48.01 AC
Address
Land Use
TOTAL SIZE
Lot Size
Zoning
249,658 SF
20.03 AC
Address
Land Use
TOTAL SIZE
Lot Size
Zoning
500,403 SF
24.69 AC
Address
Land Use
TOTAL SIZE
Lot Size
Zoning
104,537 SF
30.72 AC
Address
Land Use
TOTAL SIZE
Lot Size
Zoning
611,573 SF
26.64 AC
Address
Land Use
TOTAL SIZE
Lot Size
Zoning
87,909 SF
30.12 AC
Address
Land Use
TOTAL SIZE
Lot Size
Zoning
55.52 AC
Address
Land Use
TOTAL SIZE
Lot Size
Zoning
314,580 SF
24 AC
Address
Land Use
TOTAL SIZE
Lot Size
Zoning
76.50 AC
Address
Land Use
TOTAL SIZE
Lot Size
Zoning
849,900 SF
39.25 AC
KCSP
Address
Land Use
TOTAL SIZE
Lot Size
Zoning
214,495 SF
9.89 AC
SDCOM
Address
Land Use
TOTAL SIZE
Lot Size
Zoning
1,034,356 SF
47.48 AC
Address
Land Use
TOTAL SIZE
Lot Size
Zoning
278,453 SF
4.73 AC
Address
Land Use
TOTAL SIZE
Lot Size
Zoning
236,129 SF
10.45 AC
Address
Land Use
TOTAL SIZE
Lot Size
Zoning
118,984 SF
16.07 AC
IR
Address
Land Use
TOTAL SIZE
Lot Size
Zoning
42.45 AC
Address
Land Use
TOTAL SIZE
Lot Size
Zoning
263,532 SF
13.14 AC
Address
Land Use
TOTAL SIZE
Lot Size
Zoning
39.55 AC
Address
Land Use
TOTAL SIZE
Lot Size
Zoning
700,709 SF
34.99 AC
IR
Address
Land Use
TOTAL SIZE
Lot Size
Zoning
1,380,498 SF
74.36 AC
Address
Land Use
TOTAL SIZE
Lot Size
Zoning
234,724 SF
14.02 AC
FW
Address
Land Use
TOTAL SIZE
Lot Size
Zoning
528,253 SF
22.99 AC
Address
Land Use
TOTAL SIZE
Lot Size
Zoning
254,812 SF
6.99 AC
The World's #1 Commercial Real Estate Marketplace
Connect with us
© 2026 CoStar Group
The information above has been obtained from sources believed reliable. While we do not doubt its accuracy we have not verified it and make no guarantee, warranty or representation about it. It is your responsibility to independently confirm its accuracy and completeness. Any projections, opinions, assumptions, or estimates used are for example only and do not represent the current or future performance of the property. The value of this transaction to you depends on tax and other factors which should be evaluated by your tax, financial, and legal advisors. You and your advisors should conduct a careful, independent investigation of the property to determine to your satisfaction the suitability of the property for your needs.