Property Record
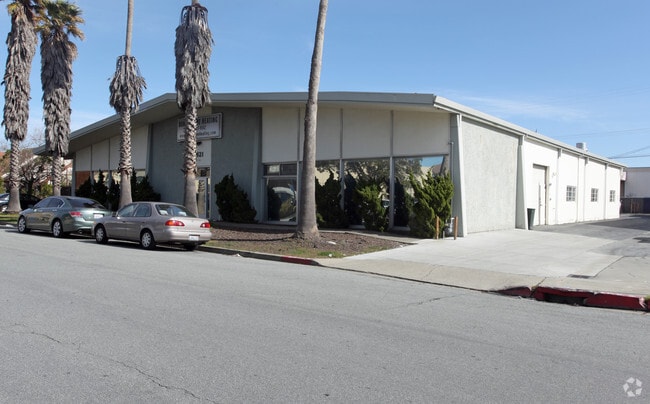
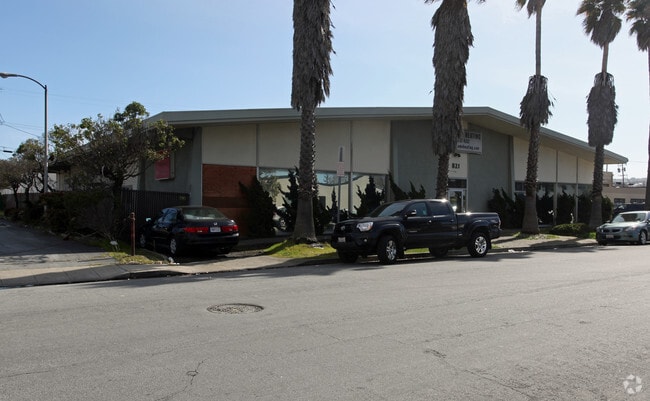
821 Malcolm Rd, Burlingame, CA 94010


Property Detail
821 Malcolm Rd
026-302-400
2.901 ACS MOL PARCEL 1 IN PM 88/34-38
Miscellaneous
San Mateo
ML00M1
California
AE The base floodplain where base flood elevations are provided. AE Zones are now used on new format FIRMs instead of A1-A30 Zones.
33,34
2024
0.48 AC
2025
Burlingame
605100
San Francisco
10,000 SF
San Francisco-San Mateo-Redwood City, CA
NEARBY LISTINGS FOR SALE OR LEASE
DEMOGRAPHICS near 821 Malcolm Rd
1 mile
3 mile
5 mile
2025 Total Population
5,408
87,083
191,847
2030 Population
5,494
87,978
193,417
Pop Growth 2025-2030
+ 1.59%
+ 1.03%
+ 0.82%
Average Age
42
42
42
2025 Total Households
1,970
32,237
69,822
HH Growth 2025-2030
+ 1.47%
+ 1.02%
+ 0.81%
Median Household Inc
$161,373
$153,861
$144,452
Avg Household Size
2.70
2.60
2.60
2025 Avg HH Vehicles
2.00
2.00
2.00
Median Home Value
$1,131,472
$1,117,167
$1,103,317
Median Year Built
1949
1959
1961
Nearby Places
Map Layers
Map Styles
 Street
 Aerial
Layers
 Traffic
 Biking
Places
Listings with unknown addresses are not visible on the map
- Restaurants
- Banks
- Shops
- Fitness
- Groceries
PUBLIC TRANSPORTATION
COMMUTER RAIL
Broadway Caltrain Station Southbound (Local Weekend - Caltrain (Caltrain))
Drive
Walk
Distance
Broadway Caltrain Station Southbound (Local Weekend - Caltrain (Caltrain))
3 min
1.3 mi
Millbrae Caltrain Station Southbound (Express - Caltrain (Caltrain), Limited - Caltrain (Caltrain), Local Weekday - Caltrain (Caltrain), Local Weekend - Caltrain (Caltrain))
Drive
Walk
Distance
Millbrae Caltrain Station Southbound (Express - Caltrain (Caltrain), Limited - Caltrain (Caltrain), Local Weekday - Caltrain (Caltrain), Local Weekend - Caltrain (Caltrain))
3 min
1.5 mi
AIRPORT
San Francisco International
Drive
Walk
Distance
San Francisco International
6 min
2.6 mi
Metro Oakland International
Drive
Walk
Distance
Metro Oakland International
39 min
29.6 mi
Norman Y Mineta San Jose International
Drive
Walk
Distance
Norman Y Mineta San Jose International
39 min
31.0 mi
Freight Ports
Port of Redwood City
Drive
Walk
Distance
Port of Redwood City
20 min
13.8 mi
Nearby Properties
Address
Land Use
TOTAL SIZE
Lot Size
Zoning
Address
Land Use
TOTAL SIZE
Lot Size
Zoning
8.65 AC
Address
Land Use
TOTAL SIZE
Lot Size
Zoning
5.73 AC
Address
Land Use
TOTAL SIZE
Lot Size
Zoning
277,784 SF
10.85 AC
Address
Land Use
TOTAL SIZE
Lot Size
Zoning
634,000 SF
8.62 AC
M10000
Address
Land Use
TOTAL SIZE
Lot Size
Zoning
5.02 AC
Address
Land Use
TOTAL SIZE
Lot Size
Zoning
19,657 SF
0.69 AC
Address
Land Use
TOTAL SIZE
Lot Size
Zoning
2.83 AC
Address
Land Use
TOTAL SIZE
Lot Size
Zoning
547,306 SF
3.93 AC
Address
Land Use
TOTAL SIZE
Lot Size
Zoning
55,000 SF
1.64 AC
ML00M1
Address
Land Use
TOTAL SIZE
Lot Size
Zoning
85,500 SF
2.20 AC
Address
Land Use
TOTAL SIZE
Lot Size
Zoning
2.57 AC
Address
Land Use
TOTAL SIZE
Lot Size
Zoning
589,128 SF
11.23 AC
Address
Land Use
TOTAL SIZE
Lot Size
Zoning
1.27 AC
Address
Land Use
TOTAL SIZE
Lot Size
Zoning
426,540 SF
9.36 AC
C40000
Address
Land Use
TOTAL SIZE
Lot Size
Zoning
294,000 SF
6.34 AC
PD0000
Address
Land Use
TOTAL SIZE
Lot Size
Zoning
20.86 AC
Address
Land Use
TOTAL SIZE
Lot Size
Zoning
32,625 SF
1.70 AC
CL00C1
Address
Land Use
TOTAL SIZE
Lot Size
Zoning
1.08 AC
RM00R4
Address
Land Use
TOTAL SIZE
Lot Size
Zoning
220,008 SF
4.64 AC
C40000
Address
Land Use
TOTAL SIZE
Lot Size
Zoning
255,185 SF
13.63 AC
ML0000
Address
Land Use
TOTAL SIZE
Lot Size
Zoning
1.48 AC
Address
Land Use
TOTAL SIZE
Lot Size
Zoning
200,068 SF
3.08 AC
Address
Land Use
TOTAL SIZE
Lot Size
Zoning
130,160 SF
1.24 AC
Address
Land Use
TOTAL SIZE
Lot Size
Zoning
1.84 AC
Address
Land Use
TOTAL SIZE
Lot Size
Zoning
106,018 SF
3.75 AC
CL00C1
Address
Land Use
TOTAL SIZE
Lot Size
Zoning
231,800 SF
3.38 AC
R10000
Address
Land Use
TOTAL SIZE
Lot Size
Zoning
140,065 SF
0.95 AC
Address
Land Use
TOTAL SIZE
Lot Size
Zoning
188,480 SF
6.01 AC
PD0000
Address
Land Use
TOTAL SIZE
Lot Size
Zoning
12.70 AC
The World's #1 Commercial Real Estate Marketplace
Connect with us
© 2026 CoStar Group
The information above has been obtained from sources believed reliable. While we do not doubt its accuracy we have not verified it and make no guarantee, warranty or representation about it. It is your responsibility to independently confirm its accuracy and completeness. Any projections, opinions, assumptions, or estimates used are for example only and do not represent the current or future performance of the property. The value of this transaction to you depends on tax and other factors which should be evaluated by your tax, financial, and legal advisors. You and your advisors should conduct a careful, independent investigation of the property to determine to your satisfaction the suitability of the property for your needs.