Property Record
8350 S Durango Dr, Las Vegas, NV 89113
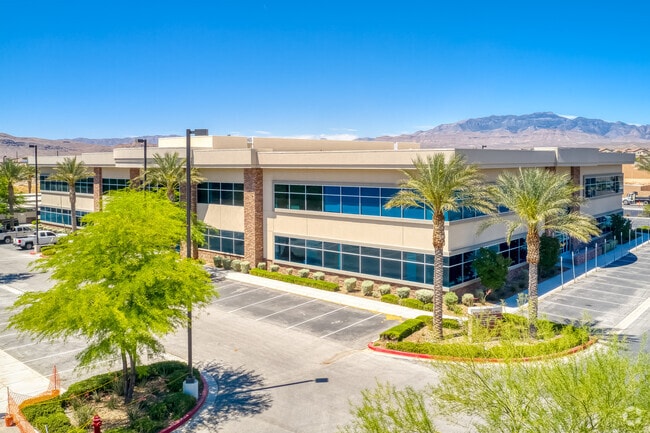


Property Detail
8350 S Durango Dr
176-16-210-001
DURANGO WINDMILL PLAT BOOK 134 PAGE 95 PT LOT 1
Commercialnec
Clark
C:C-P
Nevada
C and X Area of minimal flood hazard, usually depicted on FIRMs as above the 500-year flood level.
1
0
2.65 AC
2026
Southwest Las Vegas
002978
Las Vegas
55,982 SF
Las Vegas-Henderson-North Las Vegas, NV
NEARBY LISTINGS FOR SALE OR LEASE
DEMOGRAPHICS near 8350 S Durango Dr
1 mile
3 mile
5 mile
2025 Total Population
14,590
139,054
278,779
2030 Population
15,571
147,881
296,224
Pop Growth 2025-2030
+ 6.72%
+ 6.35%
+ 6.26%
Average Age
38
38
38
2025 Total Households
5,028
49,739
101,047
HH Growth 2025-2030
+ 6.78%
+ 6.35%
+ 6.24%
Median Household Inc
$94,534
$101,576
$98,952
Avg Household Size
2.90
2.80
2.70
2025 Avg HH Vehicles
2.00
2.00
2.00
Median Home Value
$533,940
$491,597
$487,258
Median Year Built
2008
2008
2007
Nearby Places
Map Layers
Map Styles
 Street
 Aerial
Layers
 Traffic
 Biking
Places
Listings with unknown addresses are not visible on the map
- Restaurants
- Banks
- Shops
- Fitness
- Groceries
PUBLIC TRANSPORTATION
AIRPORT
Harry Reid International
Drive
Walk
Distance
Harry Reid International
17 min
11.4 mi
Boulder City Municipal
Drive
Walk
Distance
Boulder City Municipal
42 min
31.1 mi
SALE & LEASE HISTORY
LISTING DATE
SALE/LEASE

Sep 01, 2017
For Lease
Oct 26, 2016
For Lease
Jun 22, 2018
For Lease
Jun 12, 2017
For Lease
Jan 04, 2018
For Lease
Dec 02, 2016
For Sale
Apr 25, 2018
For Lease
Apr 06, 2017
For Lease
Apr 04, 2017
For Sale
Apr 02, 2019
For Lease
Nearby Properties
Address
Land Use
TOTAL SIZE
Lot Size
Zoning
Address
Land Use
TOTAL SIZE
Lot Size
Zoning
552,417 SF
49.39 AC
H1
Address
Land Use
TOTAL SIZE
Lot Size
Zoning
205,752 SF
36.24 AC
C1
Address
Land Use
TOTAL SIZE
Lot Size
Zoning
760,651 SF
41.25 AC
Address
Land Use
TOTAL SIZE
Lot Size
Zoning
17,206 SF
225 AC
Address
Land Use
TOTAL SIZE
Lot Size
Zoning
29.59 AC
CP
Address
Land Use
TOTAL SIZE
Lot Size
Zoning
Address
Land Use
TOTAL SIZE
Lot Size
Zoning
349,295 SF
25.97 AC
Address
Land Use
TOTAL SIZE
Lot Size
Zoning
8,754 SF
17.14 AC
C2
Address
Land Use
TOTAL SIZE
Lot Size
Zoning
6,142 SF
13.96 AC
C2
Address
Land Use
TOTAL SIZE
Lot Size
Zoning
151,243 SF
22.93 AC
Address
Land Use
TOTAL SIZE
Lot Size
Zoning
401,023 SF
17.61 AC
R-3
Address
Land Use
TOTAL SIZE
Lot Size
Zoning
35.55 AC
PF
Address
Land Use
TOTAL SIZE
Lot Size
Zoning
12,349 SF
12.50 AC
Address
Land Use
TOTAL SIZE
Lot Size
Zoning
18.62 AC
PF
Address
Land Use
TOTAL SIZE
Lot Size
Zoning
396,742 SF
17.10 AC
Address
Land Use
TOTAL SIZE
Lot Size
Zoning
115,488 SF
6.41 AC
Address
Land Use
TOTAL SIZE
Lot Size
Zoning
3,398 SF
13.56 AC
Address
Land Use
TOTAL SIZE
Lot Size
Zoning
1,961 SF
4.34 AC
Address
Land Use
TOTAL SIZE
Lot Size
Zoning
398,545 SF
20.40 AC
Address
Land Use
TOTAL SIZE
Lot Size
Zoning
9.34 AC
Address
Land Use
TOTAL SIZE
Lot Size
Zoning
4,830 SF
15.84 AC
Address
Land Use
TOTAL SIZE
Lot Size
Zoning
4,199 SF
12.11 AC
RE
Address
Land Use
TOTAL SIZE
Lot Size
Zoning
107.39 AC
RE
Address
Land Use
TOTAL SIZE
Lot Size
Zoning
7,302 SF
9.21 AC
Address
Land Use
TOTAL SIZE
Lot Size
Zoning
370,870 SF
28.56 AC
MD
Address
Land Use
TOTAL SIZE
Lot Size
Zoning
4,382 SF
13.65 AC
C2
Address
Land Use
TOTAL SIZE
Lot Size
Zoning
4,446 SF
14.37 AC
Address
Land Use
TOTAL SIZE
Lot Size
Zoning
230,530 SF
15.20 AC
Address
Land Use
TOTAL SIZE
Lot Size
Zoning
422,020 SF
20.14 AC
Address
Land Use
TOTAL SIZE
Lot Size
Zoning
7,909 SF
13.39 AC
The World's #1 Commercial Real Estate Marketplace
Connect with us
© 2026 CoStar Group
The information above has been obtained from sources believed reliable. While we do not doubt its accuracy we have not verified it and make no guarantee, warranty or representation about it. It is your responsibility to independently confirm its accuracy and completeness. Any projections, opinions, assumptions, or estimates used are for example only and do not represent the current or future performance of the property. The value of this transaction to you depends on tax and other factors which should be evaluated by your tax, financial, and legal advisors. You and your advisors should conduct a careful, independent investigation of the property to determine to your satisfaction the suitability of the property for your needs.