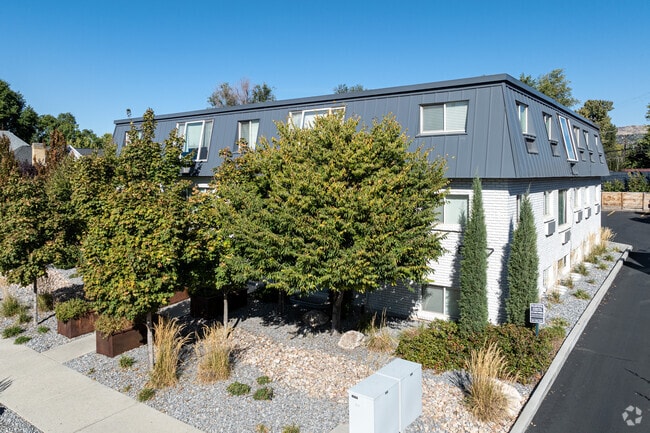
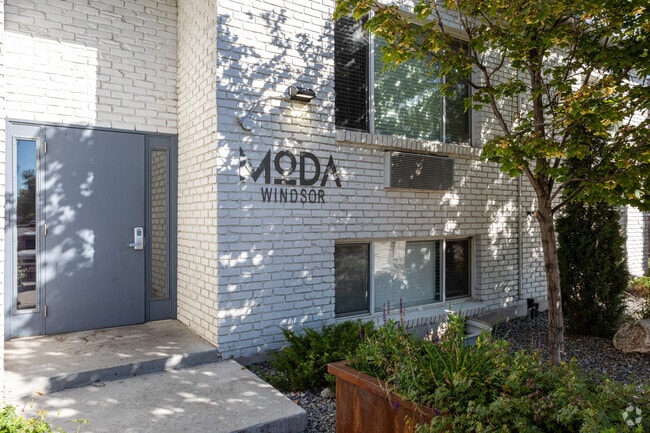
Property Record
837 E 700 S, Salt Lake City, UT 84102
NEARBY LISTINGS FOR SALE OR LEASE
Property Detail
837 E 700 S
Salt Lake City, UT
Plat B Slc Sur
16-08-126-015-0000
BEG 3 FT W FR SE COR LOT 2, BLK 16, PLAT B SLC SUR; W 3 RDS;N 10 RDS; E 3 RDS; S 10 RDS TO BEG. 4861-120 5196-0686 5893-1711 5914-0030 6422-2901 8616-0348 8891-3875 8921-5331 9249-2420 9749-5288 10498-9071
Apartment
Salt Lake
X
Utah
49029C0475C
2
2024
0.19 AC
2025
East Central
101800
Salt Lake City
7,776 SF
DEMOGRAPHICS near 837 E 700 S
1 Mile
3 Mile
5 Mile
2024 Total Population
28,369
146,232
260,606
2029 Population
28,821
149,072
264,731
Pop Growth 2024-2029
+ 1.59%
+ 1.94%
+ 1.58%
Average Age
36
37
37
2024 Total Households
14,844
68,581
111,217
HH Growth 2024-2029
+ 1.90%
+ 2.40%
+ 1.93%
Median Household Inc
$52,552
$64,318
$65,664
Avg Household Size
1.80
2.00
2.20
2024 Avg HH Vehicles
1.00
1.00
2.00
Median Home Value
$540,246
$571,501
$484,860
Median Year Built
1962
1963
1968
Nearby Places
Map Layers
Map Styles
 Street
 Aerial
- Restaurants
- Banks
- Shops
- Fitness
- Groceries
PUBLIC TRANSPORTATION
TRANSIT/SUBWAY
Trolley Square (TRAX Murray/Midvale/University Line - Utah Transit Authority (UTA), TRAX University Line - Utah Transit Authority (UTA))
DRIVE
WALK
Distance
Trolley Square (TRAX Murray/Midvale/University Line - Utah Transit Authority (UTA), TRAX University Line - Utah Transit Authority (UTA))
3 min
9 min
0.5 mi
900 East (TRAX Murray/Midvale/University Line - Utah Transit Authority (UTA), TRAX University Line - Utah Transit Authority (UTA))
DRIVE
WALK
Distance
900 East (TRAX Murray/Midvale/University Line - Utah Transit Authority (UTA), TRAX University Line - Utah Transit Authority (UTA))
2 min
10 min
0.6 mi
COMMUTER RAIL
Salt Lake Central Station (FrontRunner North - Utah Transit Authority (UTA), TRAX Salt Lake/Sandy Line - Utah Transit Authority (UTA), TRAX University Line - Utah Transit Authority (UTA))
DRIVE
WALK
Distance
Salt Lake Central Station (FrontRunner North - Utah Transit Authority (UTA), TRAX Salt Lake/Sandy Line - Utah Transit Authority (UTA), TRAX University Line - Utah Transit Authority (UTA))
9 min
3.0 mi
AIRPORT
Salt Lake City International
DRIVE
WALK
Distance
Salt Lake City International
15 min
8.7 mi
Freight Ports
Port of Oakland
DRIVE
WALK
Distance
Port of Oakland
1 min
593.0 mi
SALE & LEASE HISTORY
LISTING DATE
SALE/LEASE

May 10, 2019
For Sale
Nearby Properties
Address
Land Use
TOTAL SIZE
Lot Size
Zoning
Address
Land Use
TOTAL SIZE
Lot Size
Zoning
2,287,331 SF
137 AC
I
Address
Land Use
TOTAL SIZE
Lot Size
Zoning
1,260,285 SF
59.07 AC
I
Address
Land Use
TOTAL SIZE
Lot Size
Zoning
591,924 SF
80.77 AC
I
Address
Land Use
TOTAL SIZE
Lot Size
Zoning
298,342 SF
13.71 AC
I
Address
Land Use
TOTAL SIZE
Lot Size
Zoning
1,262,865 SF
44.15 AC
I
Address
Land Use
TOTAL SIZE
Lot Size
Zoning
1,115,174 SF
9.72 AC
D-4
Address
Land Use
TOTAL SIZE
Lot Size
Zoning
530,605 SF
127 AC
RP
Address
Land Use
TOTAL SIZE
Lot Size
Zoning
365,253 SF
33.64 AC
I
Address
Land Use
TOTAL SIZE
Lot Size
Zoning
352,836 SF
20.05 AC
PL
Address
Land Use
TOTAL SIZE
Lot Size
Zoning
350,000 SF
10 AC
U1
Address
Land Use
TOTAL SIZE
Lot Size
Zoning
295,047 SF
113.27 AC
RP
Address
Land Use
TOTAL SIZE
Lot Size
Zoning
56,741 SF
1.70 AC
D-1
Address
Land Use
TOTAL SIZE
Lot Size
Zoning
87,933 SF
4.90 AC
D-1
Address
Land Use
TOTAL SIZE
Lot Size
Zoning
185,202 SF
51.07 AC
J
Address
Land Use
TOTAL SIZE
Lot Size
Zoning
2,566,335 SF
10.01 AC
D-1
Address
Land Use
TOTAL SIZE
Lot Size
Zoning
205,570 SF
5.63 AC
UI
Address
Land Use
TOTAL SIZE
Lot Size
Zoning
1,849,748 SF
6.88 AC
D-1
Address
Land Use
TOTAL SIZE
Lot Size
Zoning
1,330,058 SF
5.02 AC
D2
Address
Land Use
TOTAL SIZE
Lot Size
Zoning
836,183 SF
5.89 AC
TSA-UC
Address
Land Use
TOTAL SIZE
Lot Size
Zoning
298,628 SF
27.30 AC
I
Address
Land Use
TOTAL SIZE
Lot Size
Zoning
807,940 SF
0.69 AC
D1
Address
Land Use
TOTAL SIZE
Lot Size
Zoning
299,535 SF
38 AC
I
Address
Land Use
TOTAL SIZE
Lot Size
Zoning
254,939 SF
34.68 AC
I
Address
Land Use
TOTAL SIZE
Lot Size
Zoning
712,539 SF
0.01 AC
D1
Address
Land Use
TOTAL SIZE
Lot Size
Zoning
1,256,042 SF
3.50 AC
D-1
Address
Land Use
TOTAL SIZE
Lot Size
Zoning
82,851 SF
9.76 AC
PL2
Address
Land Use
TOTAL SIZE
Lot Size
Zoning
440,898 SF
0.01 AC
RP
Address
Land Use
TOTAL SIZE
Lot Size
Zoning
588,291 SF
1.28 AC
D-1
Address
Land Use
TOTAL SIZE
Lot Size
Zoning
434,481 SF
10 AC
D-1
Address
Land Use
TOTAL SIZE
Lot Size
Zoning
497,018 SF
13.11 AC
I
The World's #1 Commercial Real Estate Marketplace
Connect with us
© 2026 CoStar Group
The information above has been obtained from sources believed reliable. While we do not doubt its accuracy we have not verified it and make no guarantee, warranty or representation about it. It is your responsibility to independently confirm its accuracy and completeness. Any projections, opinions, assumptions, or estimates used are for example only and do not represent the current or future performance of the property. The value of this transaction to you depends on tax and other factors which should be evaluated by your tax, financial, and legal advisors. You and your advisors should conduct a careful, independent investigation of the property to determine to your satisfaction the suitability of the property for your needs.