Property Record
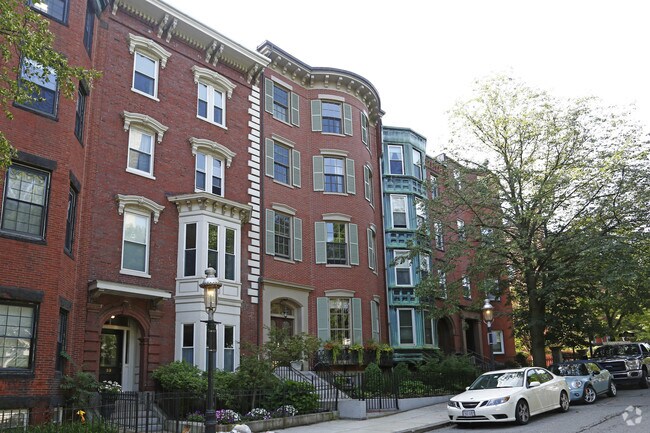
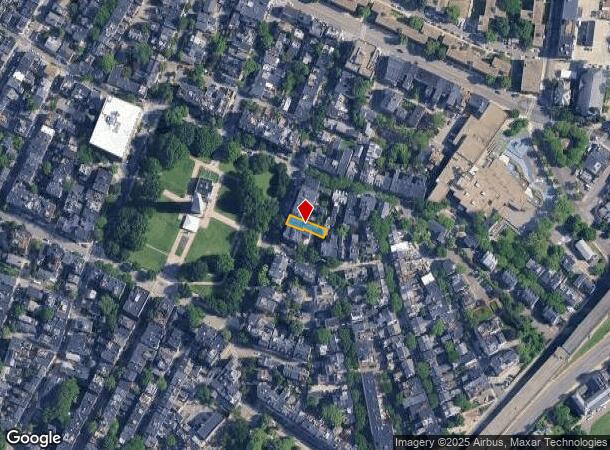
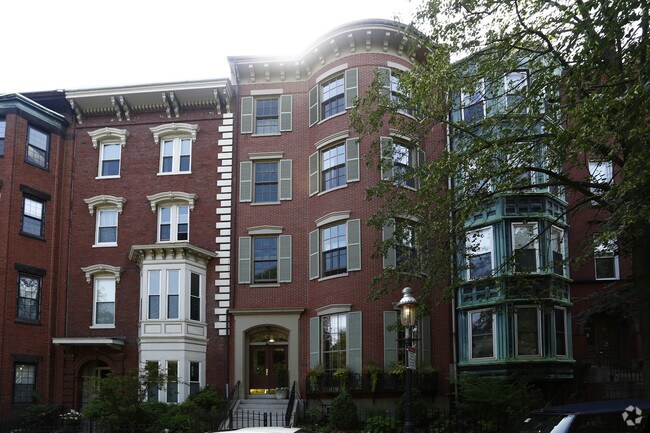
9A Monument Sq, Charlestown, MA 02129
NEARBY LISTINGS FOR SALE OR LEASE
Property Detail
9A Monument Sq
Taxexempt
Suffolk
X
Massachusetts
25017C0443F
0.06 AC
0
Bunker Hill
2025
Boston
040200
Boston-Cambridge-Newton, MA-NH
2,743 SF
CHAR-000000-000002-002794
DEMOGRAPHICS near 9A Monument Sq
1 Mile
3 Mile
5 Mile
2024 Total Population
42,918
435,855
937,726
2029 Population
41,448
422,320
905,199
Pop Growth 2024-2029
(3.43%)
(3.11%)
(3.47%)
Average Age
38
37
37
2024 Total Households
22,358
188,569
390,484
HH Growth 2024-2029
(3.69%)
(3.19%)
(3.60%)
Median Household Inc
$117,269
$96,628
$90,422
Avg Household Size
1.80
2.10
2.20
2024 Avg HH Vehicles
1.00
1.00
1.00
Median Home Value
$814,196
$822,095
$767,572
Median Year Built
1971
1950
1949
Nearby Places
Map Layers
Map Styles
 Street
 Aerial
- Restaurants
- Banks
- Shops
- Fitness
- Groceries
PUBLIC TRANSPORTATION
TRANSIT/SUBWAY
Community College Station (Orange Line - Massachusetts Bay Transportation Authority Subway (The T))
DRIVE
WALK
Distance
Community College Station (Orange Line - Massachusetts Bay Transportation Authority Subway (The T))
5 min
12 min
0.6 mi
North Station (Green Line - C - Massachusetts Bay Transportation Authority Subway (The T), Green Line - E - Massachusetts Bay Transportation Authority Subway (The T), Orange Line - Massachusetts Bay Transportation Authority Subway (The T))
DRIVE
WALK
Distance
North Station (Green Line - C - Massachusetts Bay Transportation Authority Subway (The T), Green Line - E - Massachusetts Bay Transportation Authority Subway (The T), Orange Line - Massachusetts Bay Transportation Authority Subway (The T))
3 min
18 min
0.9 mi
Haymarket Station (Green Line - C - Massachusetts Bay Transportation Authority Subway (The T), Green Line - E - Massachusetts Bay Transportation Authority Subway (The T), Orange Line - Massachusetts Bay Transportation Authority Subway (The T))
DRIVE
WALK
Distance
Haymarket Station (Green Line - C - Massachusetts Bay Transportation Authority Subway (The T), Green Line - E - Massachusetts Bay Transportation Authority Subway (The T), Orange Line - Massachusetts Bay Transportation Authority Subway (The T))
3 min
19 min
1.0 mi
COMMUTER RAIL
North Station (Fitchburg/South Acton Line - Massachusetts Bay Transportation Authority Commuter Rail (Purple Line), Haverhill Line - Massachusetts Bay Transportation Authority Commuter Rail (Purple Line), Lowell Line - Massachusetts Bay Transportation Authority Commuter Rail (Purple Line), Newburyport/Rockport Line - Massachusetts Bay Transportation Authority Commuter Rail (Purple Line))
DRIVE
WALK
Distance
North Station (Fitchburg/South Acton Line - Massachusetts Bay Transportation Authority Commuter Rail (Purple Line), Haverhill Line - Massachusetts Bay Transportation Authority Commuter Rail (Purple Line), Lowell Line - Massachusetts Bay Transportation Authority Commuter Rail (Purple Line), Newburyport/Rockport Line - Massachusetts Bay Transportation Authority Commuter Rail (Purple Line))
3 min
20 min
1.0 mi
Chelsea (Newburyport/Rockport Line - MBTA)
DRIVE
WALK
Distance
Chelsea (Newburyport/Rockport Line - MBTA)
7 min
3.4 mi
AIRPORT
General Edward Lawrence Logan International
DRIVE
WALK
Distance
General Edward Lawrence Logan International
10 min
4.0 mi
Freight Ports
Port of Boston
DRIVE
WALK
Distance
Port of Boston
10 min
4.5 mi
Nearby Properties
Address
Land Use
TOTAL SIZE
Lot Size
Zoning
Address
Land Use
TOTAL SIZE
Lot Size
Zoning
610,560 SF
4.01 AC
E
Address
Land Use
TOTAL SIZE
Lot Size
Zoning
408,667 SF
3.27 AC
C
Address
Land Use
TOTAL SIZE
Lot Size
Zoning
825,000 SF
5.17 AC
E
Address
Land Use
TOTAL SIZE
Lot Size
Zoning
125,571 SF
3.25 AC
C-3
Address
Land Use
TOTAL SIZE
Lot Size
Zoning
6.39 AC
C
Address
Land Use
TOTAL SIZE
Lot Size
Zoning
171,791 SF
166.88 AC
E
Address
Land Use
TOTAL SIZE
Lot Size
Zoning
173,400 SF
1.14 AC
MXD
Address
Land Use
TOTAL SIZE
Lot Size
Zoning
142,458 SF
1.67 AC
C-3
Address
Land Use
TOTAL SIZE
Lot Size
Zoning
334,522 SF
1.26 AC
C
Address
Land Use
TOTAL SIZE
Lot Size
Zoning
312,269 SF
0.43 AC
C
Address
Land Use
TOTAL SIZE
Lot Size
Zoning
230,394 SF
0.60 AC
MXD
Address
Land Use
TOTAL SIZE
Lot Size
Zoning
46,259 SF
1.05 AC
E
Address
Land Use
TOTAL SIZE
Lot Size
Zoning
118,759 SF
0.92 AC
C
Address
Land Use
TOTAL SIZE
Lot Size
Zoning
3.52 AC
C-3
Address
Land Use
TOTAL SIZE
Lot Size
Zoning
1.13 AC
C
Address
Land Use
TOTAL SIZE
Lot Size
Zoning
239,377 SF
0.71 AC
MXD
Address
Land Use
TOTAL SIZE
Lot Size
Zoning
3.75 AC
C
Address
Land Use
TOTAL SIZE
Lot Size
Zoning
227,107 SF
7.70 AC
E
Address
Land Use
TOTAL SIZE
Lot Size
Zoning
448,796 SF
1.84 AC
C
Address
Land Use
TOTAL SIZE
Lot Size
Zoning
341,500 SF
1.18 AC
RC
Address
Land Use
TOTAL SIZE
Lot Size
Zoning
252,392 SF
0.52 AC
C
Address
Land Use
TOTAL SIZE
Lot Size
Zoning
646,546 SF
89.28 AC
ROD
Address
Land Use
TOTAL SIZE
Lot Size
Zoning
325,020 SF
0.62 AC
RC
Address
Land Use
TOTAL SIZE
Lot Size
Zoning
237,935 SF
1.27 AC
C-3
Address
Land Use
TOTAL SIZE
Lot Size
Zoning
619,050 SF
0.45 AC
C
Address
Land Use
TOTAL SIZE
Lot Size
Zoning
386,825 SF
10.67 AC
Address
Land Use
TOTAL SIZE
Lot Size
Zoning
6.14 AC
C
Address
Land Use
TOTAL SIZE
Lot Size
Zoning
547,851 SF
8.14 AC
E
Address
Land Use
TOTAL SIZE
Lot Size
Zoning
138,316 SF
0.19 AC
RC
Address
Land Use
TOTAL SIZE
Lot Size
Zoning
401,310 SF
1.32 AC
C
The World's #1 Commercial Real Estate Marketplace
Connect with us
© 2025 CoStar Group
The information above has been obtained from sources believed reliable. While we do not doubt its accuracy we have not verified it and make no guarantee, warranty or representation about it. It is your responsibility to independently confirm its accuracy and completeness. Any projections, opinions, assumptions, or estimates used are for example only and do not represent the current or future performance of the property. The value of this transaction to you depends on tax and other factors which should be evaluated by your tax, financial, and legal advisors. You and your advisors should conduct a careful, independent investigation of the property to determine to your satisfaction the suitability of the property for your needs.