For Sale
Indianapolis, IN
Commercial Real Estate Market Trends & Data
$212
Avg asking sale price
$120
Avg asking lease rate
31,927 SF
Avg unit lease size
35,962 SF
Avg building size for sale
7.56%
Average cap rate
Indianapolis's Demographic Profile
Indianapolis has 358,372 households and a median income of $59,562, providing context for rent absorption and tenant demand across retail and multifamily assets. A -1% five-year population trend is a key signal for evaluating long-term demand in this market.
| Key Demographic Metric | Value |
|---|---|
| Population | 879,846 |
| # Households | 358,372 |
| Median age | 36 |
| Median household income | $59,562 |
| Avg household size | 2.0 |
| Renter-occupied housing units | 174,947 |
| 5-year population change | -1% |
{{marketTabHeadings[activeMarketTab]}} Market Metrics Near Indianapolis, IN
↻ Updated Monthly{{marketTabDescriptions[activeMarketTab]}}
| Nearby Office Markets | Avg Cost/SF | Typical Size | Cap Max |
|---|---|---|---|
| Indianapolis | $165 | 35,468 SF | 10.00% |
| Beech Grove | $87 | 5,200 SF | 8.00% |
| Greenwood | $195 | 12,468 SF | 6.97% |
| Nearby Retail Markets | Avg Cost/SF | Typical Size |
|---|---|---|
| Indianapolis | $281 | 12,477 SF |
| Speedway | $157 | 3,247 SF |
| Beech Grove | $199 | 6,476 SF |
| Clermont | $149 | 5,870 SF |
| Lawrence | $225 | 9,866 SF |
| Nearby Multifamily Markets | Avg Cost/SF | Typical Size | Cap Max |
|---|---|---|---|
| Indianapolis | $194 | 23,957 SF | 11.70% |
| Lawrence | $95 | 8,043 SF | 6.21% |
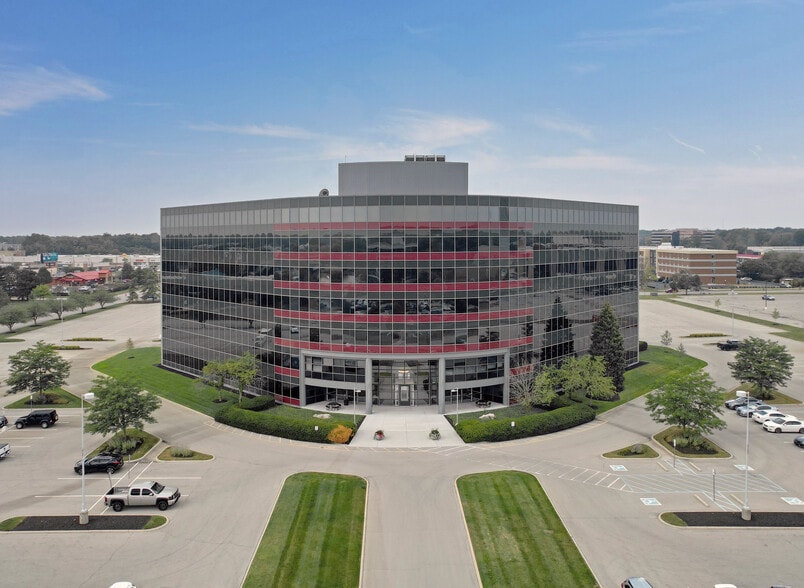
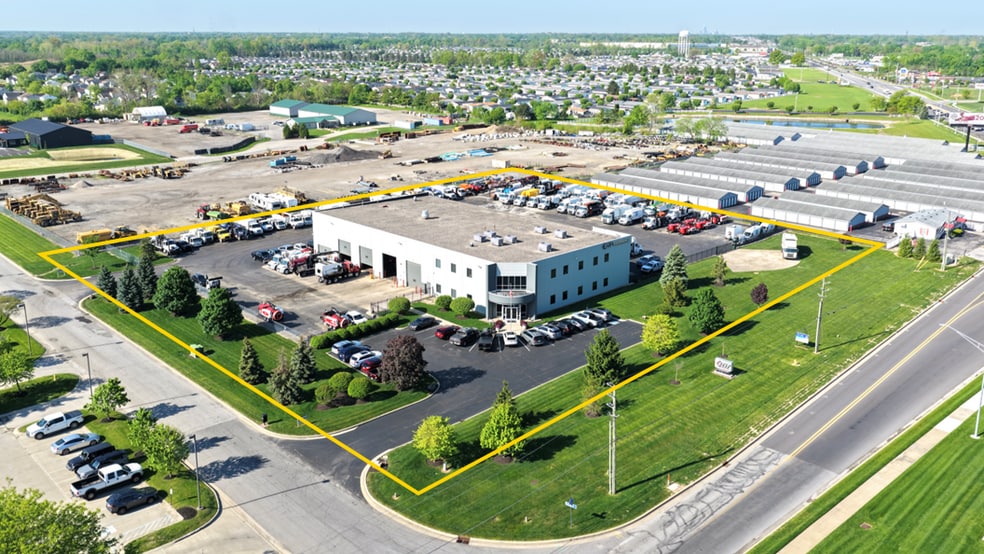
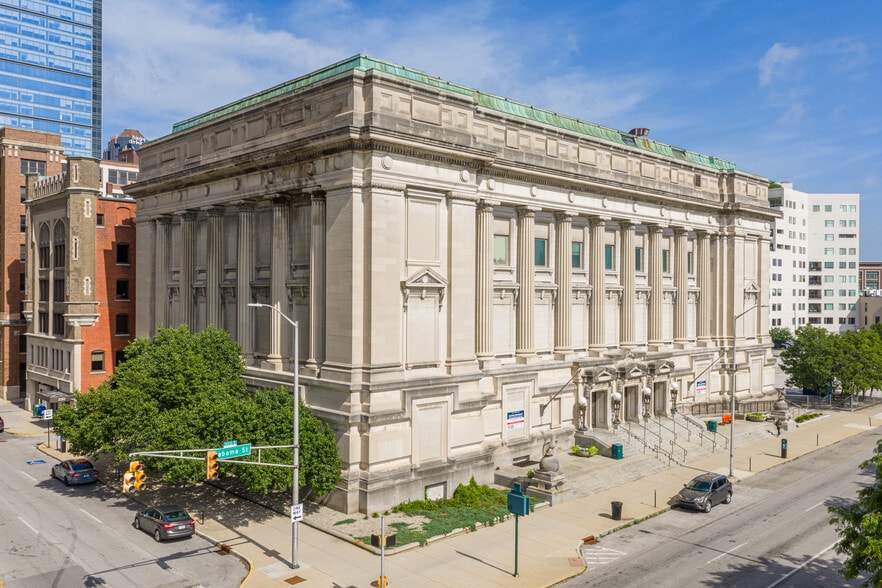
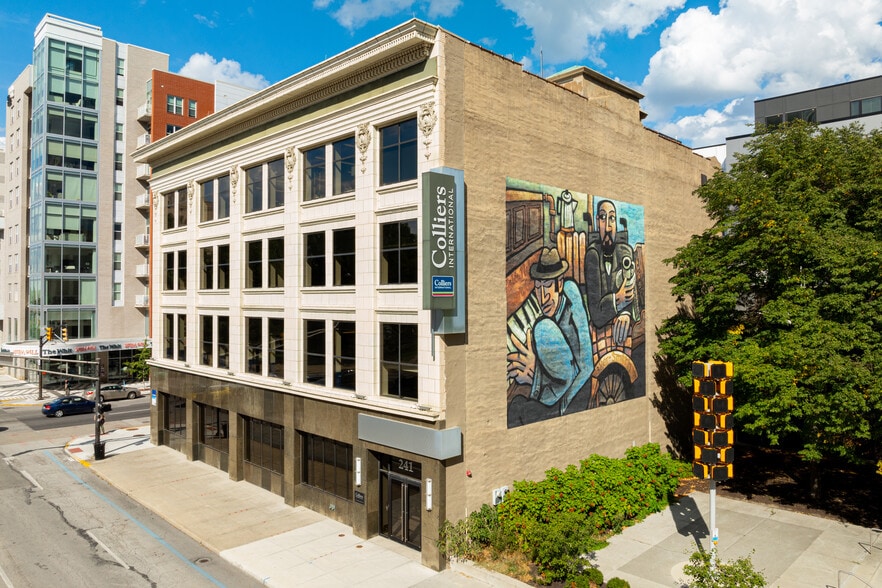
Commercial Properties For Sale in Indianapolis
The listings below reflect how current market pricing and building scale translate into active opportunities available today.
For Sale


Average Price For Sale
↻ Updated MonthlyAverage Price For Lease
↻ Updated MonthlyNumber of Listings
↻ Updated MonthlyCap Rate
↻ Updated MonthlyHow Investors Evaluate Commercial Real Estate Markets


Nearby Commercial Markets
Comparing nearby markets helps investors see whether Indianapolis pricing and building scale sit above, below, or in line with surrounding areas.
| Commercial Markets | Avg Cost/SF | Average Size |
|---|---|---|
| Indianapolis | $212 | 35,962 SF |
| Speedway | $181 | 11,055 SF |
| Beech Grove | $199 | 6,332 SF |
| Clermont | $210 | 5,870 SF |

Regional Demographic Comparison
This comparison places Indianapolis alongside nearby cities to show how population size, household counts, and income levels differ across the region. Viewing these markets side by side helps investors understand whether local demand and income characteristics are concentrated in Indianapolis or distributed across surrounding areas.
| City | Population | # Households | Age | Median Household Income | Avg Household Size | Renter Occupied Housing Units | Five Yr Pop Growth % |
|---|---|---|---|---|---|---|---|
| Indianapolis | 879,846 | 358,372 | 36 | $59,562 | 2 | 174,947 | -1% |
| Speedway | 13,383 | 5,944 | 36 | $53,063 | 2 | 3,315 | -2% |
| Beech Grove | 13,544 | 5,789 | 38 | $55,845 | 2 | 2,667 | -3% |
| Southport | 1,933 | 668 | 35 | $60,425 | 3 | 254 | -2% |
| Clermont | 1,329 | 540 | 42 | $82,265 | 3 | 123 | -4% |
Disclaimer: The figures on this page reflect LoopNet's active commercial listings in Indianapolis, IN and update as inventory changes. Averages can shift between periods or vary across property types depending on the mix of listings available at a given time, so individual metrics may not reflect broader market trends. These figures are best used as directional benchmarks for early market evaluation. For comprehensive commercial real estate data and analytics, subscribe to CoStar.
FAQs About Commercial Investing in Indianapolis
View All Commercial Real Estate For Sale in Indianapolis
Is Indianapolis a good market for a first-time commercial real estate investor?
Indianapolis offers commercial properties across a wide range of sizes and price points. By reviewing the market data and benchmarks on this page, first-time investors can better understand what a typical commercial property looks like before committing capital and narrowing in on specific listings.
How can this market data help me decide whether to buy commercial property for my business in Indianapolis?
The pricing and size metrics on this page help business owners compare the cost of ownership against leasing in Indianapolis. Typical building sizes and asking prices provide a starting point for evaluating space needs, budget fit, and long term occupancy costs before engaging lenders or brokers.
What should conservative investors focus on when evaluating commercial properties in Indianapolis?
Conservative investors often prioritize manageable deal sizes, stable pricing ranges, and cap rate benchmarks shown for Indianapolis. These metrics help assess whether current market conditions support steady income potential without relying on aggressive assumptions.
How does Indianapolis compare to nearby commercial real estate markets?
Nearby market comparisons highlight differences in pricing, building scale, and cap rate ranges relative to Indianapolis. Reviewing these side by side helps experienced investors identify relative value, pricing premiums, or alternative markets that may better align with return targets.
How can this page support early-stage deal screening for Indianapolis acquisitions?
This page provides high-level benchmarks for pricing, deal size, and observed cap rates in Indianapolis, which are useful for initial market filtering. Institutional and data-driven investors often use these signals to prioritize listings that meet size, pricing, and return thresholds before deeper underwriting.
Nearby Cities
Commercial Market Reports
- Indianapolis Commercial Real Estate Properties
- Speedway Commercial Real Estate Properties
- Beech Grove Commercial Real Estate Properties
- Southport Commercial Real Estate Properties
- Clermont Commercial Real Estate Properties
- Lawrence Commercial Real Estate Properties
- Cumberland Commercial Real Estate Properties
- Acton Commercial Real Estate Properties
- Camby Commercial Real Estate Properties
- Greenwood Commercial Real Estate Properties
- Avon Commercial Real Estate Properties
- Brownsburg Commercial Real Estate Properties
- Carmel Commercial Real Estate Properties
- New Palestine Commercial Real Estate Properties
- Plainfield Commercial Real Estate Properties
- Mccordsville Commercial Real Estate Properties
- New Whiteland Commercial Real Estate Properties
- Whiteland Commercial Real Estate Properties
- Mc Cordsville Commercial Real Estate Properties
- Fishers Commercial Real Estate Properties
- Zionsville Commercial Real Estate Properties
- Fairland Commercial Real Estate Properties
- Westfield Commercial Real Estate Properties
- Mooresville Commercial Real Estate Properties
- Pittsboro Commercial Real Estate Properties
- Bargersville Commercial Real Estate Properties
- Fortville Commercial Real Estate Properties
- Whitestown Commercial Real Estate Properties
- View more
- View less
- Atlanta, GA Market Trends
- Austin, TX Market Trends
- Boston, MA Market Trends
- Charlotte, NC Market Trends
- Chicago, IL Market Trends
- Columbus, OH Market Trends
- Dallas, TX Market Trends
- Denver, CO Market Trends
- Fort Worth, TX Market Trends
- Houston, TX Market Trends
- Indianapolis, IN Market Trends
- Jacksonville, FL Market Trends
- Kansas City, MO Market Trends
- Las Vegas, NV Market Trends
- Los Angeles, CA Market Trends
- Nashville, TN Market Trends
- Philadelphia, PA Market Trends
- Phoenix, AZ Market Trends
- San Diego, CA Market Trends
- San Francisco, CA Market Trends
- San Jose, CA Market Trends
- Seattle, WA Market Trends
- Washington, DC Market Trends
- View more
- View less