House Hacking Index: The Best Cities for Beginner Investors
Key Takeaways
- Indianapolis, IN, Cincinnati, OH, and Detroit, MI are the top three ranked cities for house hacking, offering the best balance of market health, low holding costs, and high investment returns.
- Midwest Dominance: The Midwest is the premier region for house hacking, claiming five of the top seven spots in the rankings.
Whether you're looking to offset your mortgage or take your first step into real estate investing, house hacking can be an accessible way to build wealth. The strategy involves buying a small multifamily property—such as a duplex, triplex, or fourplex-living in one unit, and renting out the others to help cover your housing costs. It's a popular duplex investing strategy that can also be used in triplexes and fourplexes.
But not every market offers the same opportunity. Factors such as home prices, rental demand, financing availability, and local regulations can influence whether a property is a smart investment. To help aspiring investors identify the strongest markets, LoopNet analyzed active two to four-unit multifamily listings across 50 U.S. cities, combining proprietary listing data with trusted public sources to rank the best cities for house hacking in 2026.
What Is House Hacking?
House hacking is a strategy where you buy a small multifamily property, live in one unit, and rent out the others to help cover your mortgage.
The approach typically applies to duplexes, triplexes, and fourplexes, since these properties qualify for owner-occupant financing while still generating rental income from the other units. Because the owner lives on-site, lenders treat the purchase as a primary residence rather than a pure investment property, which opens the door to loan programs like FHA that require lower down payments and easier qualification standards than conventional investment loans.
For first-time investors, house hacking offers a lower-risk entry point into real estate. Rental income from tenants can offset some or all of the mortgage payment, reducing the buyer's out-of-pocket housing costs while they build equity and gain hands-on property management experience.
In this index, you'll find the top-performing cities overall, the most affordable markets for first-time buyers, and the locations with the strongest rental demand and return potential. These insights can help you narrow your search, whether you're researching your first owner-occupied investment property, deciding on a duplex vs. triplex or fourplex, or comparing markets.
How We Ranked the Best House Hacking Cities
LoopNet analyzed two, three and four-unit multifamily listings across the most populous U.S. cities to identify the best markets for first-time house hackers in 2026. Cities were scored across eight variables and ranked by composite index score.
What We Measured
- Affordability: median price per unit and FHA financing accessibility
- Income Potential: gross yield from renting non-owner-occupied units
- Rental Demand: vacancy rates and renter income-to-rent ratio
- Market Growth: five-year population change
- Holding Costs: effective property tax rate and landlord regulatory environment
The Best Cities for House Hacking
LoopNet's House Hacking Index ranks the most populous U.S. cities based on a combination of affordability, income potential, rental demand, market growth, and holding costs.
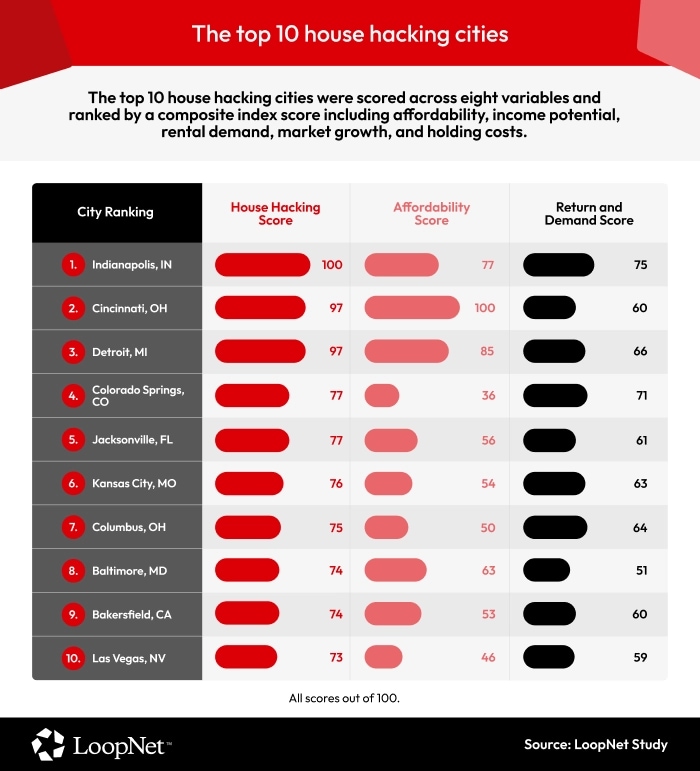
The Midwest and Rust Belt dominate the rankings, claiming five of the top seven spots. Indianapolis ranks as the best city overall for beginner house hackers, followed by Cincinnati and Detroit. These markets strike a balance between affordable entry prices, financing accessibility through FHA loan limits, and strong rental income potential. These cities are making it easier for first-time investors to purchase multifamily properties while maximizing returns.
Outside the Midwest, Colorado Springs, Jacksonville, Baltimore, and Bakersfield show that attractive house-hacking opportunities can also be found in the West and South, though they often come with different trade-offs between affordability and rental performance.
While high-cost markets such as New York and San Francisco remain challenging entry points for first-time house hackers due to significantly higher purchase prices, the interactive map highlights that strong opportunities exist across the country. Explore the rankings to see how cities perform nationwide and identify markets that best align with your investment priorities.
The Top Five Cities for House Hacking
1. Indianapolis, Indiana
Indianapolis claims the top spot on the strength of the most favorable combination of entry cost and income return in the study. Among other Indianapolis CRE trends, the median price of $124,750 per unit is among the lowest of any city analyzed. Indiana's effective property tax rate also means house hackers keep more of their rental income compared to other cities. With a 4.1% vacancy rate and an estimated gross yield of 15.28%, Indianapolis offers first-timers a rare combination of low barriers to entry and strong returns.
2. Cincinnati, Ohio
Cincinnati ranks second on the back of the strongest financing accessibility score in the entire index. The FHA four-unit loan limit of $1,041,125 is more than four times the city's median two to four unit listing price, meaning FHA financing is effectively unconstrained for first-time buyers in this market. At a median price per unit of $82,917, the lowest in the top five, Cincinnati offers the most affordable entry point of any ranked city.
3. Detroit, Michigan
Detroit's ranking reflects the same core affordability dynamic driving the top of this index: extremely low entry costs relative to income potential. Detroit commercial real estate data demonstrate's the city's low price-per-unit figures, with FHA financing covering 3.8 times the median listing price. A gross yield of 14.3% signals strong income return potential relative to purchase price. Deeply discounted property values combined with stable rental demand create compelling house hacking fundamentals that more celebrated markets can't match on price alone. Browse current Detroit commercial real estate data to see how these numbers play out property by property.
4. Colorado Springs, Colorado
Colorado Springs ranks fourth on the strength of its overall gross yield (8%) and one of the lowest vacancy rates in the study at just 3%, signaling consistent tenant demand. Its median price per unit of $217,250 sits well below the national average for Western markets, making entry more accessible than comparable Colorado cities like Denver ($437,500). Strong population growth of 3% further supports long-term rental demand, and a favorable landlord regulatory environment keeps holding costs manageable for first-time investors.
5. Jacksonville, Florida
Jacksonville earns its No. 5 ranking through a compelling combination of high gross yield (11%) and strong estimated annual rental income of $56,448, among the highest in the top ten. Jacksonville CRE data shows a relatively affordable median price per unit of $134,250 means investors can enter the market without sacrificing returns, producing one of the better yield-to-price ratios among top cities. Population growth of 7% over five years reflects a city drawing new residents steadily, bolstering occupancy over time. The main trade-off is a higher vacancy rate of 11%, which investors should account for when projecting cash flow.
The Complete House Hacking Handbook
Use the interactive table below to explore LoopNet's complete ranking of all 50 cities included in the House Hacking Index. Sort and compare markets across key metrics to find the locations that best match your investment strategy.
The Best Cities for House Hacking in 2026
This table helps you explore the complete House Hacking Index and compare how all 50 cities performed across the metrics that matter most to first-time investors. Whether affordability, rental income potential, vacancy rates, or long-term market growth is your priority, the data can help you identify the markets that best align with your investment goals.
No single metric tells the whole story, as the strongest house-hacking opportunities typically balance affordability, rental demand, and return potential, making it important to evaluate each market from multiple perspectives before making an investment decision.
The Most Affordable Cities for House Hacking
These cities offer a balance of affordable median price per unit compared to the localized FHA loan limit.
While the overall House Hacking Index considers a range of investment factors, the rankings below focus specifically on affordability. These cities are ranked by median price per unit and FHA loan limit coverage, highlighting markets where first-time investors may find it easier to purchase a two to four-unit multifamily property and get started with house hacking.
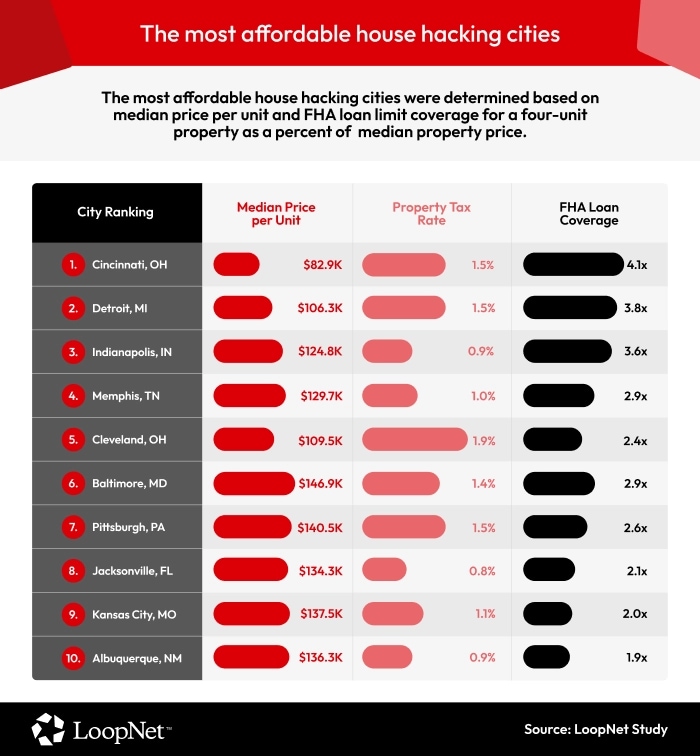
For many first-time investors, affordability is the biggest barrier to getting started. This sub-ranking focuses on the most affordable cities for house hacking, based on two measures: median price per unit and FHA loan limit coverage as a percentage of the median property price.
FHA loans are especially relevant for house hackers because they allow owner-occupants to purchase a two- to four-unit property with as little as 3.5% down, far lower than the down payment typically required for conventional investment property financing. However, FHA loan limits cap how much can be borrowed, and those limits vary by location and unit count. Thus, a market's FHA loan limit relative to its property prices determines how accessible financing actually is there.
Together, these metrics highlight markets where buyers may face lower upfront costs while also benefiting from financing that stretches further.
Cincinnati ranks as the most affordable city for house hacking, followed by Detroit and Indianapolis. In Cincinnati, the FHA loan limit for a four-unit property is 4.1 times the median price of a two to four-unit multifamily property, illustrating just how far FHA financing can go in the market. Many of the highest-ranked cities combine relatively low property prices with generous FHA loan coverage, helping reduce one of the biggest hurdles for aspiring owner-occupants looking to purchase their first multifamily investment.
The 10 Most Affordable Cities for House Hacking
Based on median price per unit and FHA loan limit coverage.
- Cincinnati, OH
- Detroit, MI
- Indianapolis, IN
- Memphis, TN
- Cleveland, OH
- Baltimore, MD
- Pittsburgh, PA
- Jacksonville, FL
- Kansas City, MO
- Albuquerque, NM
The Top Cities for Rental Demand and Return Potential
These cities offer a strong mix of vacancy rate, median rent, gross yield, and estimated annual rental income.
Not every affordable market delivers strong rental returns, and not every high-return market is easy to enter. The rankings below isolate the cities with the strongest rental demand and return potential, using rental vacancy rates, median rent, renter income-to-rent ratio, and gross yield rather than the overall House Hacking Score.

Strong rental demand can help keep units occupied, while healthy rental income improves a property's earning potential. This sub-ranking identifies the cities with the strongest combination of rental demand and return potential, based on rental vacancy rates, median rent, renter income-to-rent ratio, and gross yield.
Indianapolis tops the rankings thanks to its low 4.1% vacancy rate and market-leading gross yield of 15.2%, making it one of the most profitable cities for multifamily investment making it one of the strongest markets for generating rental income. Colorado Springs climbs to second place, demonstrating that higher-priced markets can still offer attractive returns when rental demand is robust. Detroit rounds out the top three, while Fort Worth, Seattle, Austin, and Raleigh also stand out for their ability to generate high rental income despite ranking lower in overall House Hacking Score due to higher entry costs.
The 10 Cities With the Most Rental Demand and Return Potential
Based on vacancy rate, median rent, gross yield, and estimated annual rental income.
- Indianapolis, IN
- Colorado Springs, CO
- Detroit, MI
- Fort Worth, TX
- Columbus, OH
- Seattle, WA
- Kansas City, MO
- Jacksonville, FL
- Austin, TX
- Raleigh, NC
Finding the Right City for Your House Hacking Journey
The best markets for beginner investors aren't necessarily those with the lowest home prices or the highest rental income. The strongest opportunities balance affordability, financing accessibility, rental demand, and return potential. While Midwestern cities such as Indianapolis, Cincinnati, and Detroit stand out for offering this combination, the rankings also highlight promising opportunities in markets like Colorado Springs, Jacksonville, and Fort Worth, where strong rental fundamentals can help offset higher entry costs.
For first-time house hackers, these findings provide a practical starting point, not a final answer. Once you've identified markets that align with your budget and investment goals, the next step is to research individual properties, compare financing options, and evaluate local market conditions. It's also worth comparing small vs. large multifamily properties to determine which scale best fits your strategy, whether you're considering how to buy a duplex or considering a duplex, triplex, or fourplex for sale instead. Looking beyond a city's overall rank to understand how it performs across affordability, rental demand, and long-term growth can help you make a more informed investment decision.
Having clear visibility into those opportunities matters. LoopNet has been a trusted commercial real estate marketplace for more than 30 years, with over 300,000 active listings and over $380 billion in transaction volume. Whether you're searching for your first duplex, triplex, or fourplex, LoopNet's market insights, comparison tools, and extensive inventory of multifamily listings can help you identify your next investment opportunity with confidence.
Methodology
To identify the best U.S. cities for first-time house hackers, LoopNet analyzed active two to four-unit multifamily listings across the most populous U.S. cities and scored each market across eight variables reflecting affordability, income potential, rental demand, market growth, and holding costs. Cities were ranked by composite index score.
Data Sources
| Variable | Source | Vintage |
|---|---|---|
| Listing price, gross yield inputs, unit count | LoopNet active listings | As of May 2026 |
| Rental vacancy rate | U.S. Census Bureau ACS Table B25004 | 2024 (2023 where 2024 unavailable) |
| Median gross rent | U.S. Census Bureau ACS Table B25064 | 2024 (2023 where 2024 unavailable) |
| Renter household income | U.S. Census Bureau ACS Table B25119 | 2024 (2023 where 2024 unavailable) |
| FHA loan limits | HUD FHA Mortgage Limits | CY2026 |
| Effective property tax rate | Tax Foundation | 2024 |
| Landlord regulatory environment | LSC Eviction Laws Database | Retrieved May 2026 |
City Selection
The final 50 cities were selected from among the most populous U.S. cities with sufficient active two to four-unit listing data to produce reliable city-level averages. Cities were required to have a minimum of five active two to four-unit multifamily listings on LoopNet at the time of data collection. Population estimates are sourced from the U.S. Census Bureau 2025 Population Estimates Program.
Index Variables and Weights
Each city was scored on eight variables normalized to a 0-100 scale and combined into a weighted composite index score. Higher scores indicate more favorable conditions for first-time house hackers.
Key Calculations
Gross Yield reflects estimated annual rental income from non-owner-occupied units as a percentage of the median listing price, assuming the owner occupies one unit and rents the remaining units. Median gross rent is sourced from ACS city-wide estimates across all rental unit types and may vary from rents specific to two to four-unit properties.
Gross Yield = ( Median Gross Rent x 12 x (Median Number of Units - 1)) / Median Listing Price x 100
Renter Income to Rent Ratio measures annual rent as a share of median renter household income, reflecting the financial capacity of the local tenant pool.
Rent-to-Income Ratio = (Median Gross Rent x 12) / Median Renter Household Income x 100
Finance Accessibility measures how far FHA financing stretches relative to typical listing prices in each market. A ratio above 1.0x indicates FHA financing fully covers the median listing price.
FHA Coverage = HUD Four-Unit FHA Limit / Median Listing Price
Scoring and Normalization
Each variable was normalized to a 0-100 scale using min-max normalization, where 100 represents the most favorable value across all cities for that variable. For cities missing data on one or more variables, composite scores were calculated by redistributing weights proportionally across available variables. Landlord regulatory environment is scored at the state level; cities within the same state receive identical scores for this variable.
Limitations
Listing data reflects active LoopNet listings as of May 2026 and may not represent the full market of available two to four-unit properties in each city
Gross yield is a gross figure calculated before operating expenses including property taxes, insurance, maintenance, and vacancy. It should not be interpreted as net operating income or cap rate
ACS data carries a one to two-year lag and reflects survey estimates subject to margins of error, particularly for smaller geographies
Landlord regulatory environment reflects state-level eviction law data retrieved in May 2026 and captures minimum notice periods and just cause requirements only. It does not reflect the full complexity of landlord-tenant law in each jurisdiction
City-level averages may not reflect neighborhood-level variation within markets; investors should conduct property-level due diligence before making investment decisions
Several index variables are measured at the county or state level and assigned to cities accordingly. Property tax rates and FHA loan limits reflect county-level data matched to each city's primary county, defined as the county containing the city's downtown core.
Fair Use Statement
Did you find this research valuable? We welcome you to share our findings and the accompanying infographics for your own content. However, we ask that you link back to this page to credit LoopNet as the source.
Disclaimer: The figures presented in this article are based on a snapshot of LoopNet's active listings as of the publication date and may not reflect current market conditions. For comprehensive, commercial real estate data, subscribe to CoStar.
