Property Record
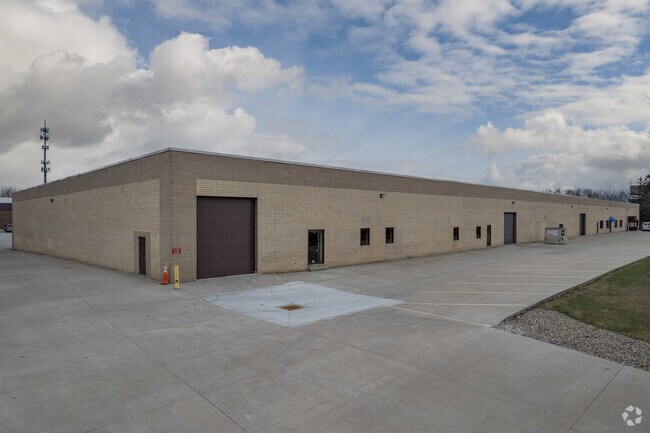
20365 Progress Dr, Strongsville, OH 44149


Property Detail
20365 Progress Dr
392-23-022
74 NEXT S OF PROGRESS DR
Multitenantindustrial
Cuyahoga
GI
Ohio
A Areas with a 1% annual chance of flooding and a 26% chance of flooding over the life of a 30-year mortgage.
74
2025
4.27 AC
2025
Strongsville/N Rylton
186103
Cleveland
64,800 SF
Cleveland-Elyria, OH
NEARBY LISTINGS FOR SALE OR LEASE
DEMOGRAPHICS near 20365 Progress Dr
1 mile
3 mile
5 mile
2025 Total Population
6,543
48,205
126,865
2030 Population
6,500
47,763
126,057
Pop Growth 2025-2030
(0.66%)
(0.92%)
(0.64%)
Average Age
46
44
44
2025 Total Households
2,670
20,014
52,444
HH Growth 2025-2030
(0.71%)
(1.18%)
(0.77%)
Median Household Inc
$93,815
$93,771
$88,814
Avg Household Size
2.30
2.30
2.30
2025 Avg HH Vehicles
2.00
2.00
2.00
Median Home Value
$292,101
$271,793
$259,307
Median Year Built
1978
1976
1975
Nearby Places
Map Layers
Map Styles
 Street
 Aerial
Layers
 Traffic
 Biking
Places
Listings with unknown addresses are not visible on the map
- Restaurants
- Banks
- Shops
- Fitness
- Groceries
PUBLIC TRANSPORTATION
AIRPORT
Cleveland-Hopkins International
Drive
Walk
Distance
Cleveland-Hopkins International
23 min
10.3 mi
Akron-Canton Regional
Drive
Walk
Distance
Akron-Canton Regional
63 min
45.5 mi
SALE & LEASE HISTORY
LISTING DATE
SALE/LEASE

Sep 25, 2016
For Lease
Oct 19, 2018
For Sale
Feb 18, 2025
For Lease
Dec 06, 2017
For Lease
Aug 23, 2020
For Lease
Nearby Properties
Address
Land Use
TOTAL SIZE
Lot Size
Zoning
Address
Land Use
TOTAL SIZE
Lot Size
Zoning
127,666 SF
2.79 AC
Address
Land Use
TOTAL SIZE
Lot Size
Zoning
830,541 SF
51.19 AC
SC
Address
Land Use
TOTAL SIZE
Lot Size
Zoning
184,998 SF
20.43 AC
PF
Address
Land Use
TOTAL SIZE
Lot Size
Zoning
345,524 SF
107.02 AC
PF
Address
Land Use
TOTAL SIZE
Lot Size
Zoning
244,717 SF
23.97 AC
RMF-1
Address
Land Use
TOTAL SIZE
Lot Size
Zoning
62,681 SF
5.48 AC
OB
Address
Land Use
TOTAL SIZE
Lot Size
Zoning
127,666 SF
9.53 AC
Address
Land Use
TOTAL SIZE
Lot Size
Zoning
309,231 SF
34.28 AC
Address
Land Use
TOTAL SIZE
Lot Size
Zoning
310,080 SF
28.30 AC
GI
Address
Land Use
TOTAL SIZE
Lot Size
Zoning
143,074 SF
25.34 AC
PDA-2
Address
Land Use
TOTAL SIZE
Lot Size
Zoning
437,700 SF
36.09 AC
GI
Address
Land Use
TOTAL SIZE
Lot Size
Zoning
53,653 SF
30.83 AC
Address
Land Use
TOTAL SIZE
Lot Size
Zoning
288,114 SF
27.52 AC
GB
Address
Land Use
TOTAL SIZE
Lot Size
Zoning
230,291 SF
17.35 AC
Address
Land Use
TOTAL SIZE
Lot Size
Zoning
263,867 SF
59.28 AC
PF
Address
Land Use
TOTAL SIZE
Lot Size
Zoning
124,195 SF
54.96 AC
PF
Address
Land Use
TOTAL SIZE
Lot Size
Zoning
426.60 AC
PF
Address
Land Use
TOTAL SIZE
Lot Size
Zoning
381,528 SF
42.50 AC
GI
Address
Land Use
TOTAL SIZE
Lot Size
Zoning
34,005 SF
514.86 AC
PF
Address
Land Use
TOTAL SIZE
Lot Size
Zoning
275,274 SF
16.91 AC
RMF-1
Address
Land Use
TOTAL SIZE
Lot Size
Zoning
180,606 SF
10.99 AC
Address
Land Use
TOTAL SIZE
Lot Size
Zoning
112,629 SF
9.62 AC
RSF-B
Address
Land Use
TOTAL SIZE
Lot Size
Zoning
149,184 SF
14.09 AC
PDA-2
Address
Land Use
TOTAL SIZE
Lot Size
Zoning
185,284 SF
10.84 AC
Address
Land Use
TOTAL SIZE
Lot Size
Zoning
183,240 SF
15.80 AC
SC
Address
Land Use
TOTAL SIZE
Lot Size
Zoning
243,375 SF
2.43 AC
RMF-1
Address
Land Use
TOTAL SIZE
Lot Size
Zoning
187,761 SF
19.98 AC
GB
Address
Land Use
TOTAL SIZE
Lot Size
Zoning
215,025 SF
2.69 AC
RMF-1
Address
Land Use
TOTAL SIZE
Lot Size
Zoning
354,820 SF
10.01 AC
RMF-1
Address
Land Use
TOTAL SIZE
Lot Size
Zoning
62,070 SF
18.43 AC
GB
The World's #1 Commercial Real Estate Marketplace
Connect with us
© 2026 CoStar Group
The information above has been obtained from sources believed reliable. While we do not doubt its accuracy we have not verified it and make no guarantee, warranty or representation about it. It is your responsibility to independently confirm its accuracy and completeness. Any projections, opinions, assumptions, or estimates used are for example only and do not represent the current or future performance of the property. The value of this transaction to you depends on tax and other factors which should be evaluated by your tax, financial, and legal advisors. You and your advisors should conduct a careful, independent investigation of the property to determine to your satisfaction the suitability of the property for your needs.